Gold Price Analysis: XAU/USD extends sideways grind near $1,850

- Gold is fluctuating in a very tight range on Friday.
- XAU/USD could push higher if it manages to break above 200-SMA on H4 chart.
- Key support for gold is located at $1,817.
The XAU/USD pair registered small daily gains on Thursday but struggled to extend its recovery amid a lack of significant fundamental drivers on Friday. As of writing, the pair was up 0.15% on a daily basis at $1,849.
Gold technical outlook
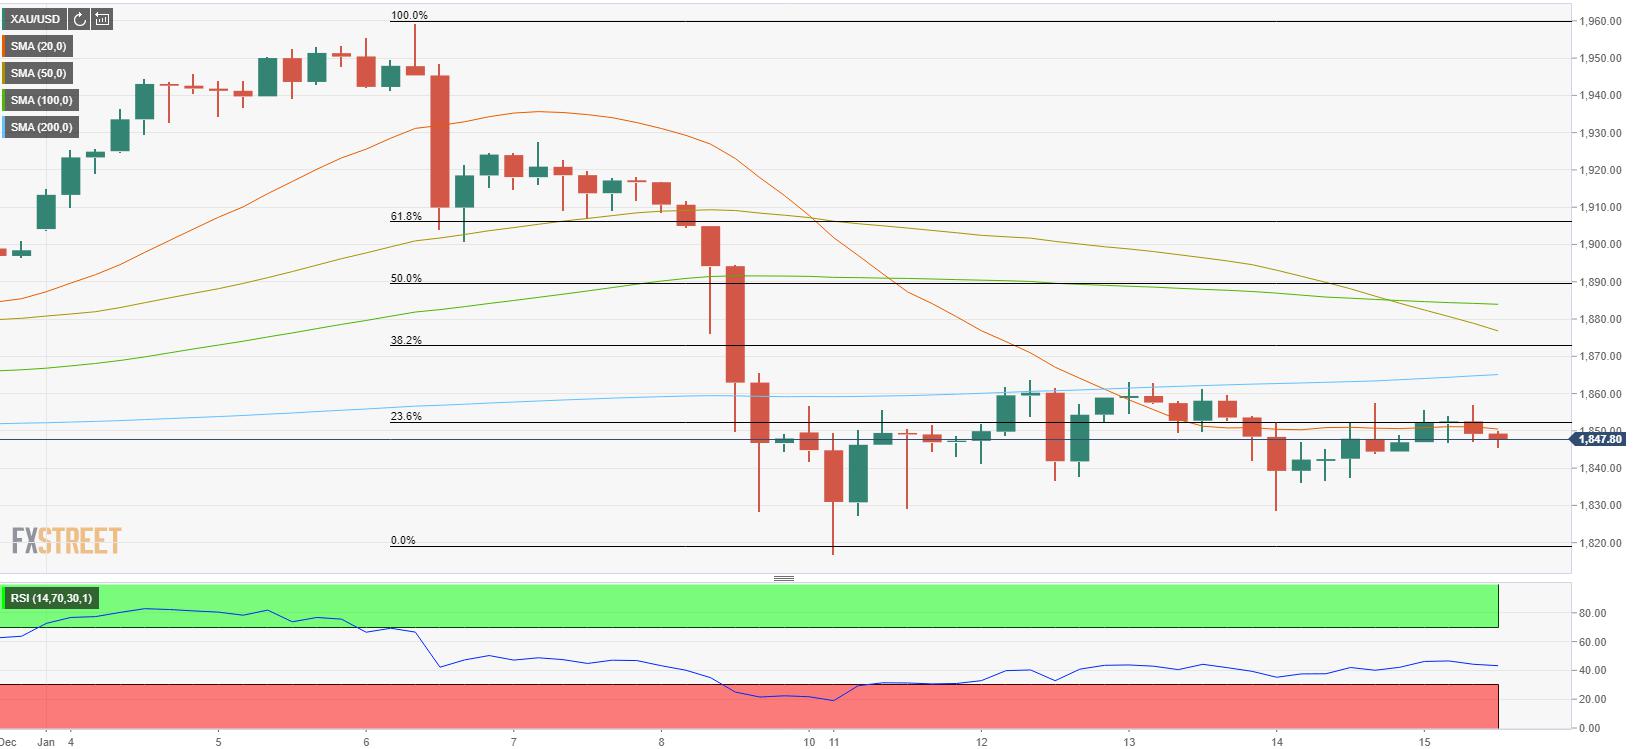
On the four-hour chart, the Relative Strength Index (RSI) indicator is moving sideways a little below 50, confirming the pair's indecisiveness in the near term.
The initial resistance for gold aligns at $1,852, where the Fibonacci 23.6% retracement of the sharp decline seen from January 6 to 11 is located. Above that level, the 200-SMA is the next hurdle at $1,865. In the past seven trading days, XAU/USD failed to break above that level and if it manages to do so, it could target the next Fibo retracement level at $1,872.
On the other hand, key support seems to have formed at $1,817 (January 11 low). A daily close below that level could trigger a technical selloff and cause XAU/USD to extend its slide toward $1,800 (psychological level).
XAU/USD H4 chart
Reprinted from FXStreet,the copyright all reserved by the original author.
Disclaimer: The content above represents only the views of the author or guest. It does not represent any views or positions of FOLLOWME and does not mean that FOLLOWME agrees with its statement or description, nor does it constitute any investment advice. For all actions taken by visitors based on information provided by the FOLLOWME community, the community does not assume any form of liability unless otherwise expressly promised in writing.
FOLLOWME Trading Community Website: https://www.followme.com


Hot
No comment on record. Start new comment.