DJI 30 close to full uptrend continuation despite wedge

-
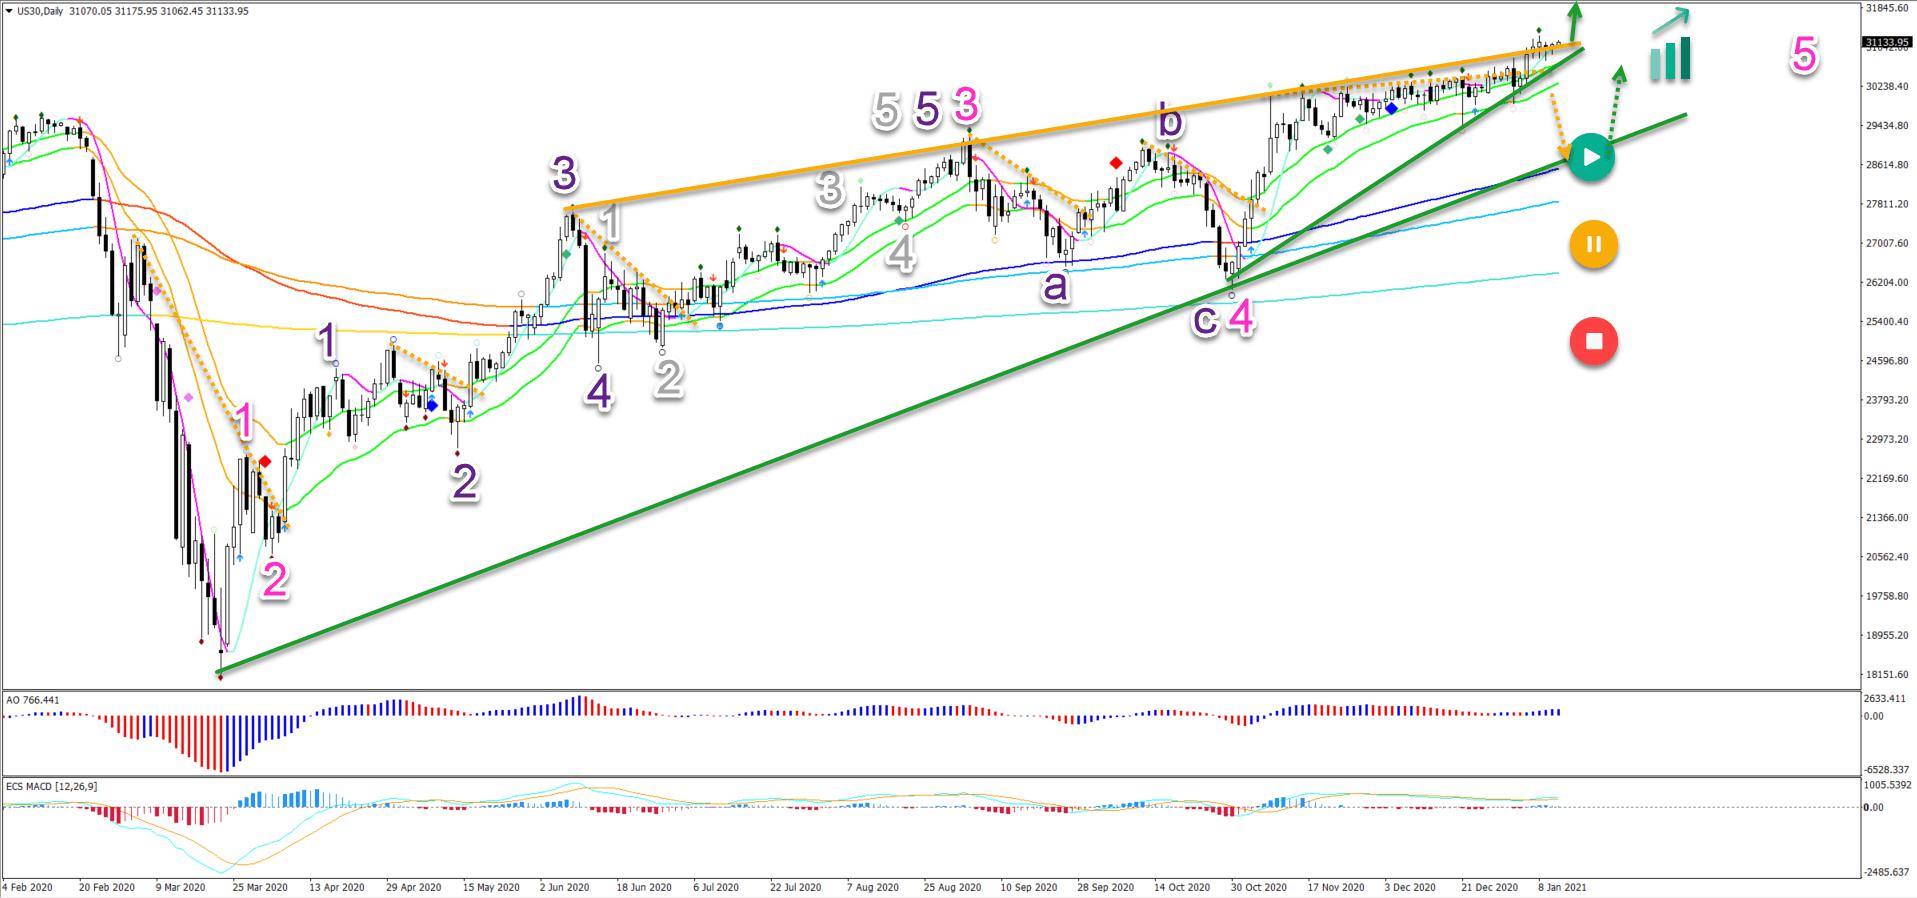
Dow Jones Index (US 30) is in a strong uptrend. Although price action has recently become quite slow and choppy.
-
A rising wedge pattern is visible as well. Will the bulls be able to push through resistance to keep the uptrend alive?
-
A bullish breakout could trigger strong momentum to the upside, because price action is breaking the wedge.
Price Charts and Technical Analysis
The US30 chart needs a break above the current high at 31,263 to confirm the uptrend.
A bearish break below the 21 ema zone, however, is not worrying for the bulls.
-
Price action could simply be making a deeper retracement.
-
A bullish bounce at the long trend line and moving averages is likely.
-
Only a deeper break below the long-term MAs could put the uptrend on pauze (yellow & red circles).
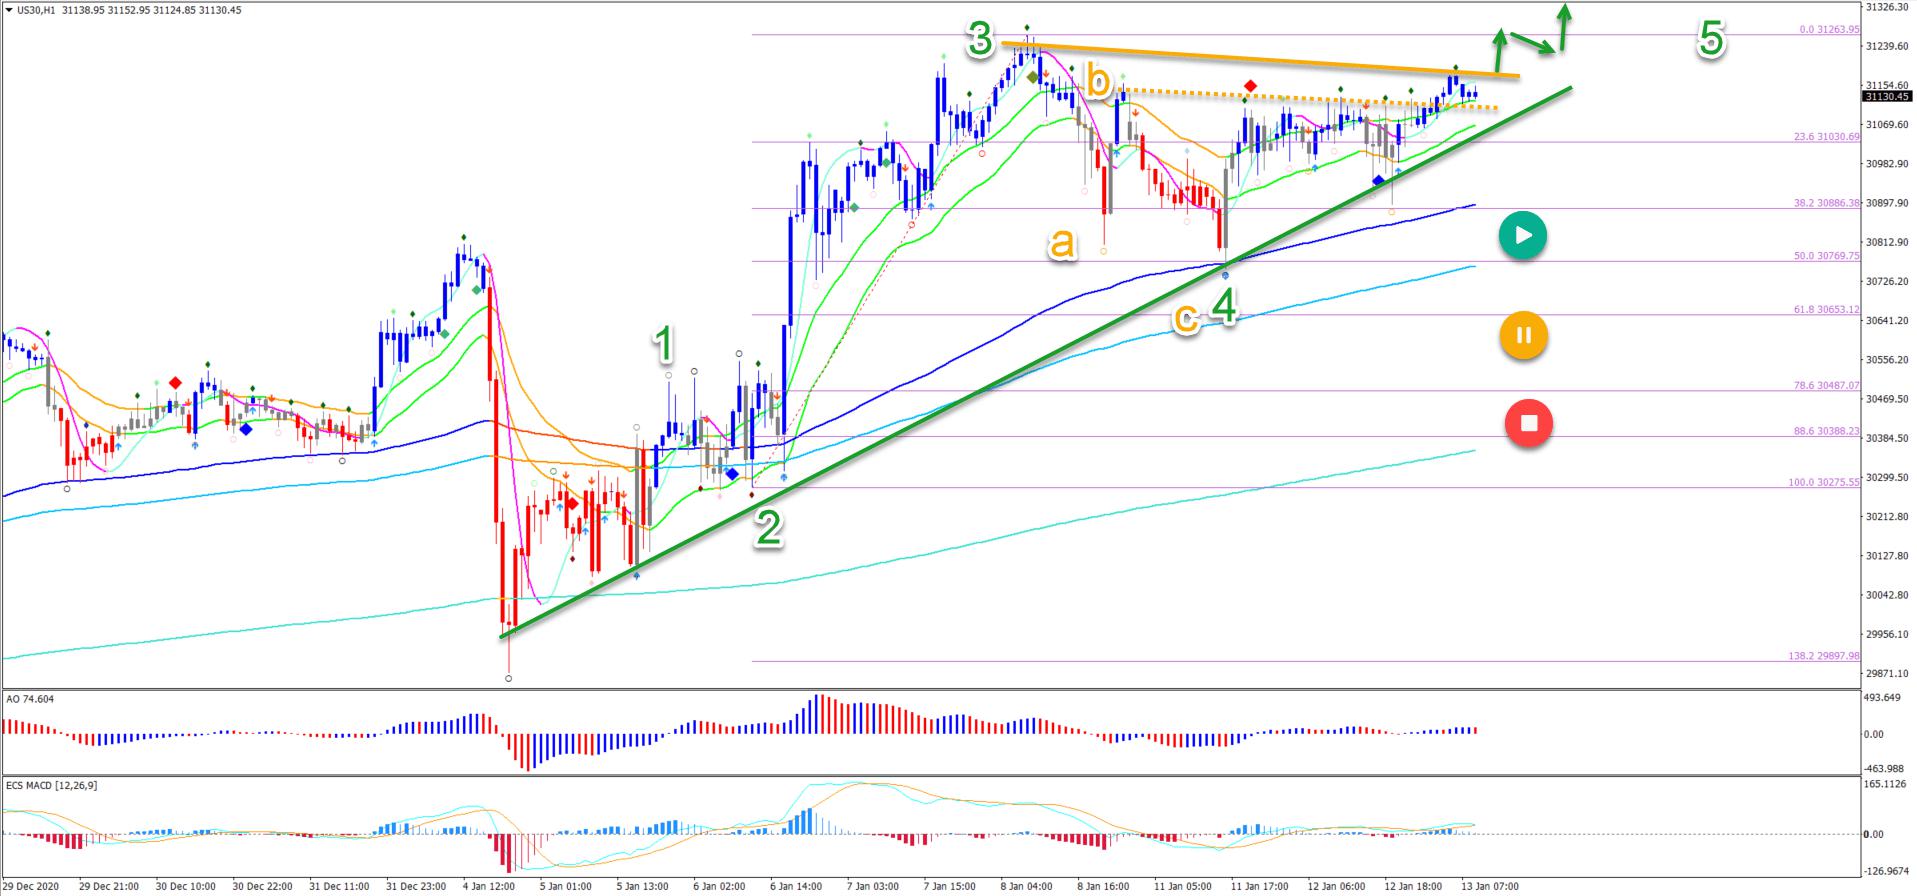
On the 1 hour chart, we can see that an ABC (orange) pattern has been completed at the 50% Fibonacci level. A bullish bounce seems to confirm the end of the wave 4 (green).
A bullish break above the resistance trend line (orange) could confirm the uptrend continuation. Main targets are located at $31,500 to $32,500.
The analysis has been done with the ecs.SWAT method and ebook.
Reprinted from FXStreet,the copyright all reserved by the original author.
Disclaimer: The content above represents only the views of the author or guest. It does not represent any views or positions of FOLLOWME and does not mean that FOLLOWME agrees with its statement or description, nor does it constitute any investment advice. For all actions taken by visitors based on information provided by the FOLLOWME community, the community does not assume any form of liability unless otherwise expressly promised in writing.
FOLLOWME Trading Community Website: https://www.followme.com


Hot
No comment on record. Start new comment.