USD/JPY Price Analysis: Key 102.69 support appears at risk ahead of Georgia’s elections

- USD/JPY’s path of least resistance appears to the downside.
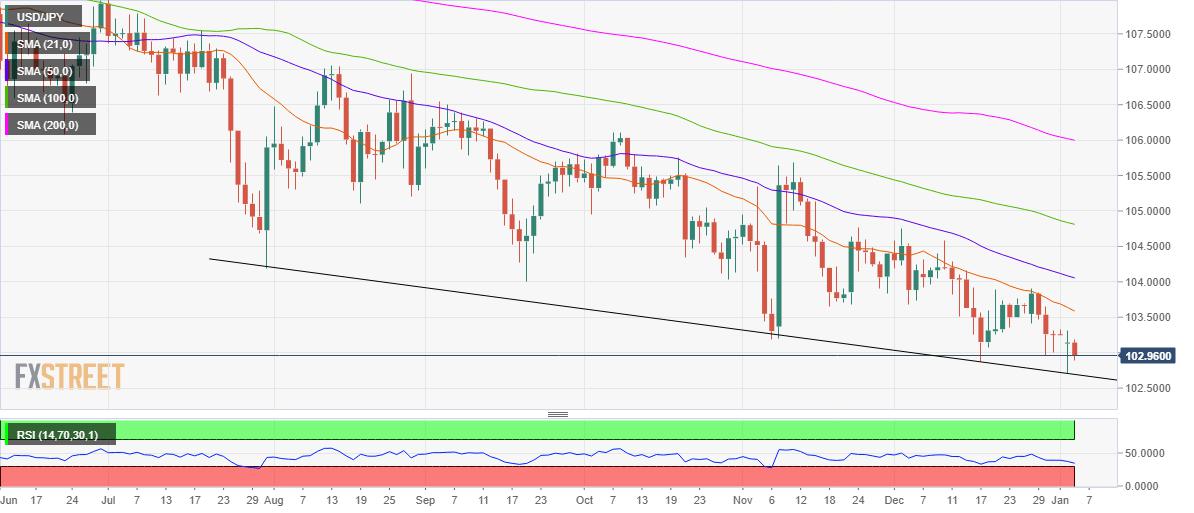
- Bears threaten five-month-old descending trendline support at 102.69
- RSI stays bearish but above the oversold region.
USD/JPY trades with mild losses below the 103 level, having faced rejection just above Monday’s close of 103.14.
Markets remain worried about the surge in coronavirus cases and the resultant imposition of stricter curbs worldwide.
On the other side, coronavirus vaccine optimism and expectations that the Democrats could likely seek control of Congress in the critical Georgia run-off elections lend some support to the USD/JPY bulls.
However, from the technical perspective, the bias appears to the downside in the major. The daily chart shows that the bears have fought back control on Tuesday after charting three consecutive doji candlesticks.
The bears remain poised to test the five-month-old descending trendline support, now seen at 102.69.
The 14-day Relative Strength Index (RSI) points south, heading towards the oversold territory. This suggests that there is more scope for additional downside moves.
Also, adding credence to the bearish bias, the spot trades below all the major daily moving averages (DMA).
A breach of the abovementioned critical support could expose the psychological 102.50 level.
Alternatively, a sustained recovery above daily highs of 103.19 could offer some temporary reprieve to the buyers.
Further up, Monday’s high of 103.31 could be tested, as the bulls look to recapture the bearish 21-DMA at 103.58.
USD/JPY: Daily chart
USD/JPY: Additional levels
Reprinted from FXStreet,the copyright all reserved by the original author.
Disclaimer: The content above represents only the views of the author or guest. It does not represent any views or positions of FOLLOWME and does not mean that FOLLOWME agrees with its statement or description, nor does it constitute any investment advice. For all actions taken by visitors based on information provided by the FOLLOWME community, the community does not assume any form of liability unless otherwise expressly promised in writing.
FOLLOWME Trading Community Website: https://www.followme.com


Hot
No comment on record. Start new comment.