WTI Price Analysis: Bulls eye $48.00, recovery moves need validation from 200-HMA

- WTI keeps bounce off $47.25, regains 61.8% above Fibonacci retracement.
- Recovering RSI, break of immediate resistance favor oil buyers.
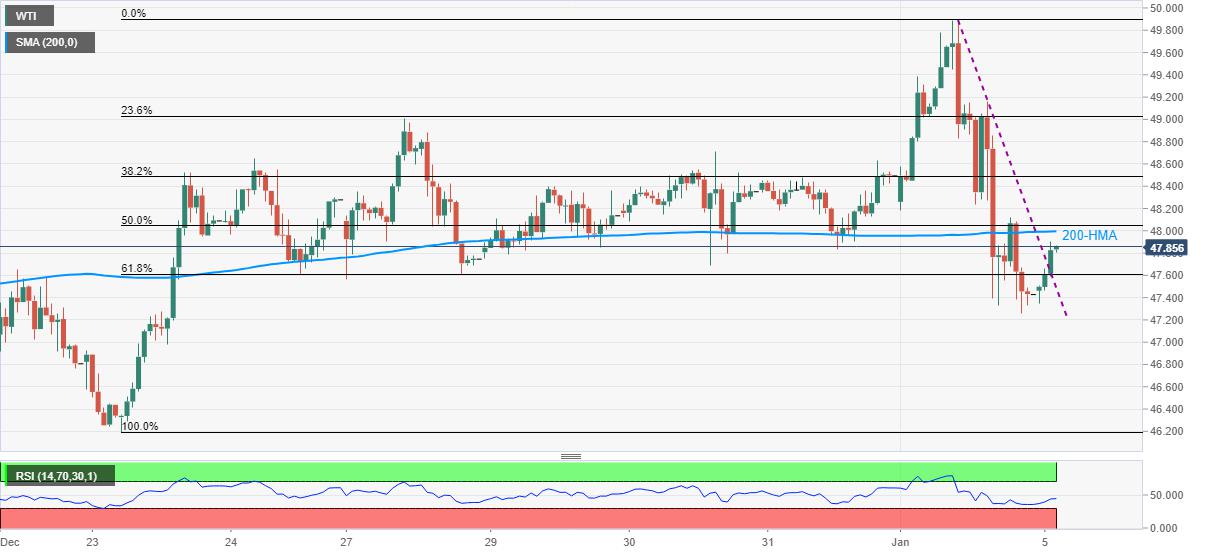
WTI recovers Monday’s losses while picking up the bids around $47.85, up 0.86% intraday, during Tuesday’s Asian session. In doing so, the oil benchmark bounces back beyond the 61.8% Fibonacci retracement of December 23 to January 04 upside while also breaking a downward sloping trend line from the previous day.
Given the RSI recovery backing the upside signals stated above, WTI is likely to overcome the immediate hurdle of 200-HMA, currently near $48.00.
Though, any further upside moves need clear trading beyond December 28 top of $29.00 to target the $50.00 threshold.
Meanwhile, 61.8% Fibonacci retracement near $47.60, the previous resistance line, now support around $47.50 and Monday’s low of $47.25 can entertain short-term sellers during the fresh declines.
Though, November high joins late-December lows near $46.30/20 to challenge WTI’s downside past-$47.25.
WTI hourly chart
Trend: Pullback expected
Reprinted from FXStreet,the copyright all reserved by the original author.
Disclaimer: The content above represents only the views of the author or guest. It does not represent any views or positions of FOLLOWME and does not mean that FOLLOWME agrees with its statement or description, nor does it constitute any investment advice. For all actions taken by visitors based on information provided by the FOLLOWME community, the community does not assume any form of liability unless otherwise expressly promised in writing.
FOLLOWME Trading Community Website: https://www.followme.com


Hot
No comment on record. Start new comment.