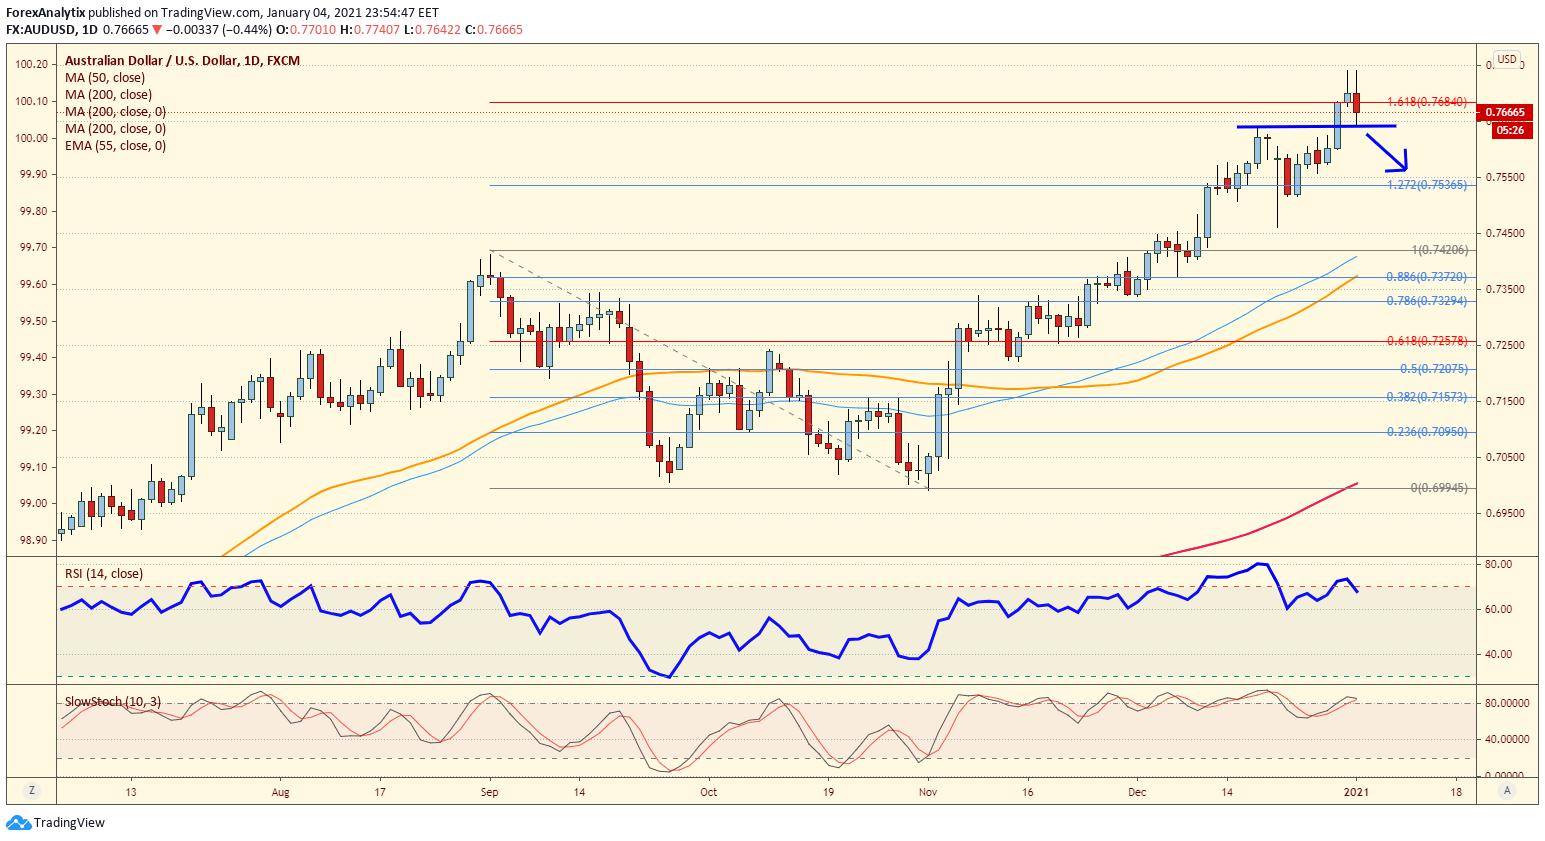
Chart of the Day: AUD/USD

Intraday, the AUDUSD set up a double top (which is currently playing out) but the tweezer top daily candles and a possible break below the .7630 level could expose a move back to the .7420 August highs.
Daily RSI is divergent which is a stern warning for the bulls.
We should also note the multiyear Fibonacci retracement (38.2%) is also at .7630 (not pictured).
Reprinted from FXStreet,the copyright all reserved by the original author.
Disclaimer: The content above represents only the views of the author or guest. It does not represent any views or positions of FOLLOWME and does not mean that FOLLOWME agrees with its statement or description, nor does it constitute any investment advice. For all actions taken by visitors based on information provided by the FOLLOWME community, the community does not assume any form of liability unless otherwise expressly promised in writing.
FOLLOWME Trading Community Website: https://www.followme.com


Hot
No comment on record. Start new comment.