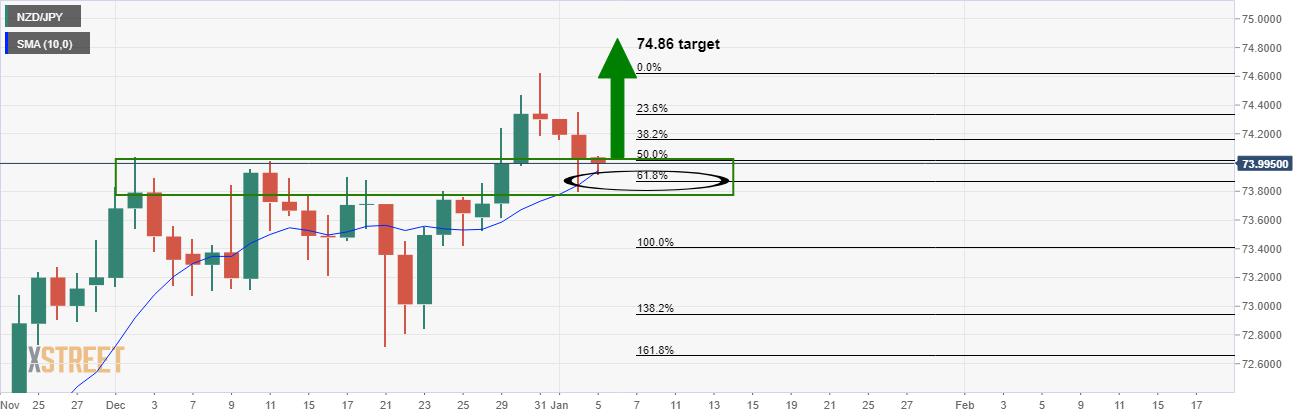
NZD/JPY Price Analysis: Bulls targetting the 74.80s

- NZD/JPY bulls taking back control on the daily chart.
- The monthly chart, however, is overextended to the upside.
NZD/JPY is on the brink of an upside extension while price holds above the daily 61.8% Fibonacci and the 10-day moving average.
The following is a top-down analysis that illustrates the market's stricture and bullish bias.
Monthly chart
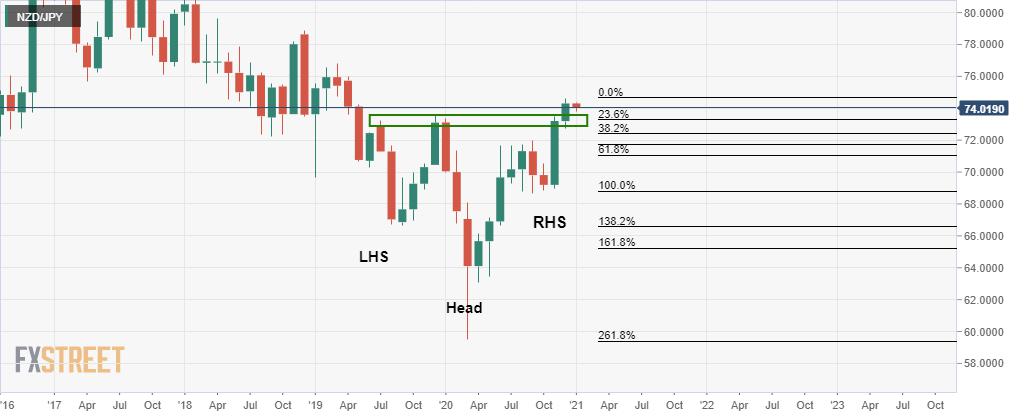
The price is overextended on the monthly chart and is due to a correction:
However, while at least a 38.2% Fibonacci retracement is not out of the question, the price is holding above a significant support level.
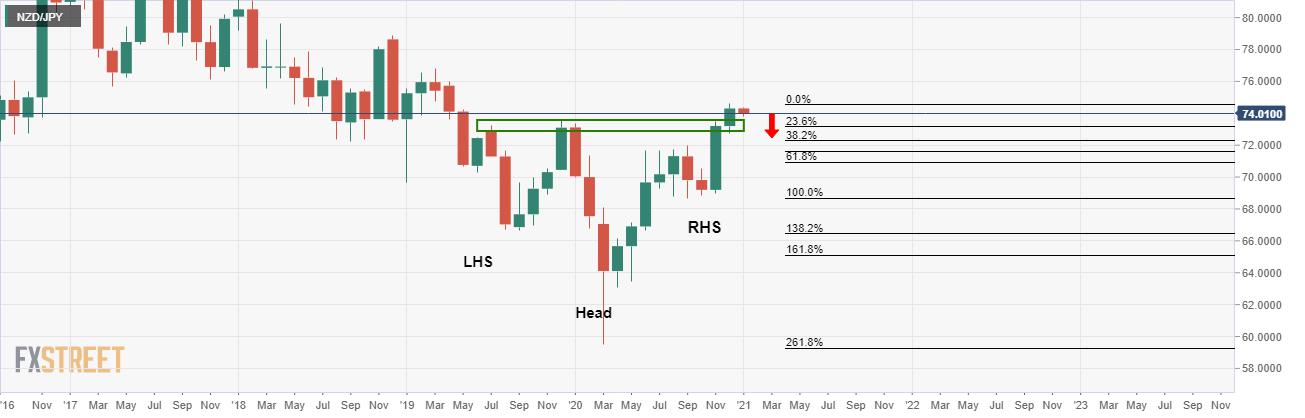
Weekly chart
As can be seen on the weekly chart, the price tested the support with a significant rejection followed by a follow-through to the upside and a new high.
This leaves the bulls in control.
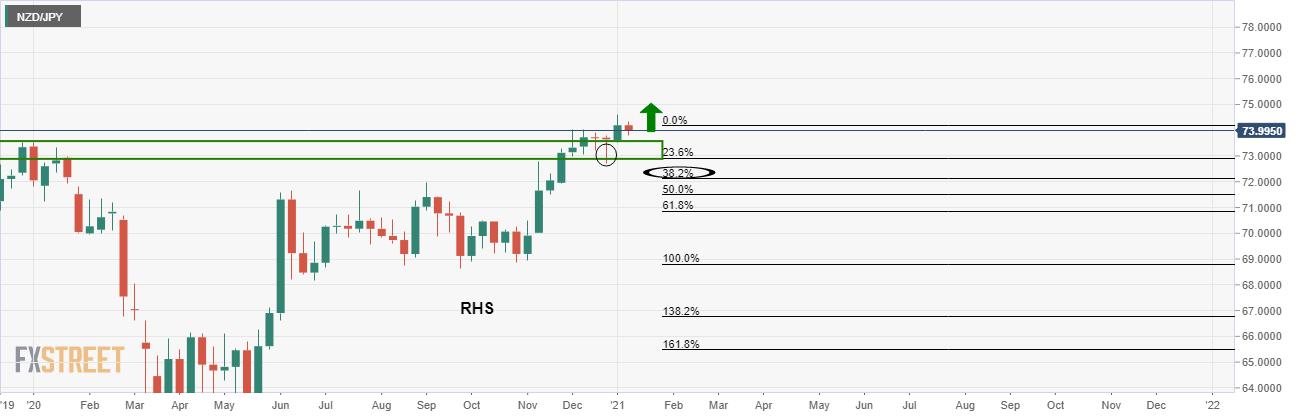
Daily chart
From a daily perspective, the price is offering a bullish bias as well following a meaningful correction to the 61.8% Fibonacci.
So long as the 10-day moving average holds, the price would now be expected to extend higher from here and opportunities could be found on the lower time frames.
Reprinted from FXStreet,the copyright all reserved by the original author.
Disclaimer: The content above represents only the views of the author or guest. It does not represent any views or positions of FOLLOWME and does not mean that FOLLOWME agrees with its statement or description, nor does it constitute any investment advice. For all actions taken by visitors based on information provided by the FOLLOWME community, the community does not assume any form of liability unless otherwise expressly promised in writing.
FOLLOWME Trading Community Website: https://www.followme.com


Hot
No comment on record. Start new comment.