USD/CAD Price Analysis: Bulls battle 100-bar SMA, two-week-old resistance line

- USD/CAD wavers in a choppy range after notable comeback.
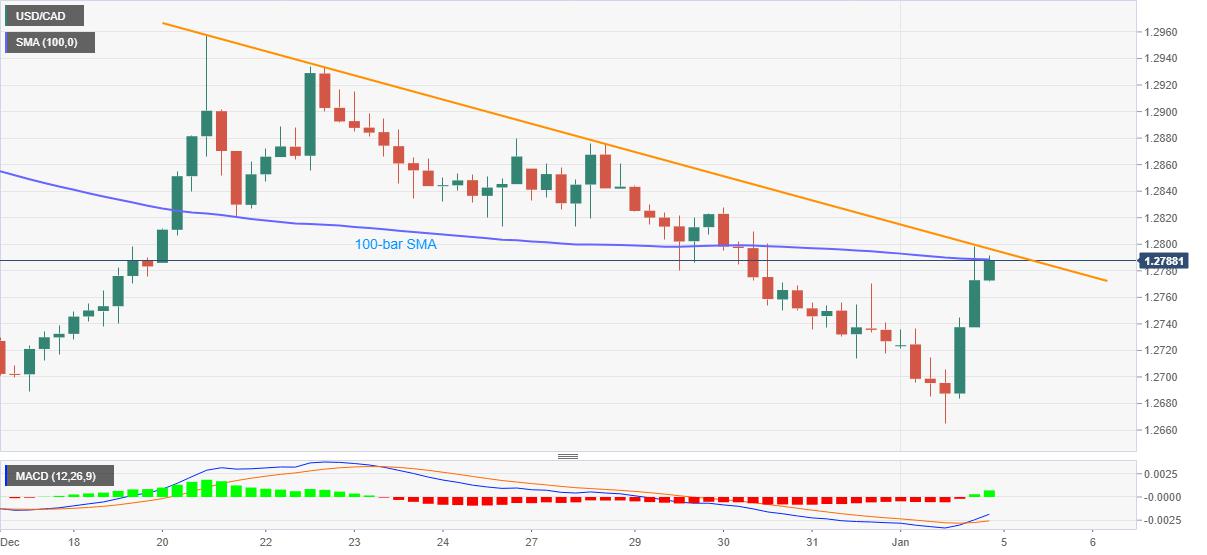
- Bullish MACD, risk-off mood favor buyers but 1.2800 holds the gate for further upside.
- April 2018 lows can lure sellers should prices revisit sub-1.2700 area.
USD/CAD keeps trading between 1.2770 and 1.2798, currently around 1.2785, during early Tuesday morning in Asia. The pair bounced off a fresh multi-month low the previous day and turned the MACD green.
However, bulls are yet to cross the key upside hurdles, namely 100-bar SMA and a falling trend line from December 21 to retake the controls.
Hence, a clear break above 1.2800 will recall buyers targeting the late December tops near 1.2880 and the 1.2930 resistances.
It should, however, be noted that cautious sentiment will unless USD/CAD crosses the December high of 1.3010.
Meanwhile, fresh selling can wait for a downside break below the 1.2700 round-figure. Following that, April 2018 low near 1.2530/25 will lure the USD/CAD bears.
USD/CAD four-hour chart
Trend: Pullback expected
Reprinted from FXStreet,the copyright all reserved by the original author.
Disclaimer: The content above represents only the views of the author or guest. It does not represent any views or positions of FOLLOWME and does not mean that FOLLOWME agrees with its statement or description, nor does it constitute any investment advice. For all actions taken by visitors based on information provided by the FOLLOWME community, the community does not assume any form of liability unless otherwise expressly promised in writing.
FOLLOWME Trading Community Website: https://www.followme.com


Hot
No comment on record. Start new comment.