NZD/USD Price Analysis: Conflicting structure across the time frames, make or break time

- NZD/USD is on the watchlist for both a bullish and bearish prospect, depending on daily and weekly support.
- A break of weekly support opens risk for a significant pullback.
NZD/USD is trading on the backfoot due to dollar weakness and volatility on Wallstreet. However, the pair could be in for an extension to the upside so long as the current support holds the initial tests.
The following is a top-down analysis which illustrates that a break of daily support, then the monthly 38.2% Fibonacci retracement level will be in focus which will match the COT data's reduction in long positioning.
Monthly chart
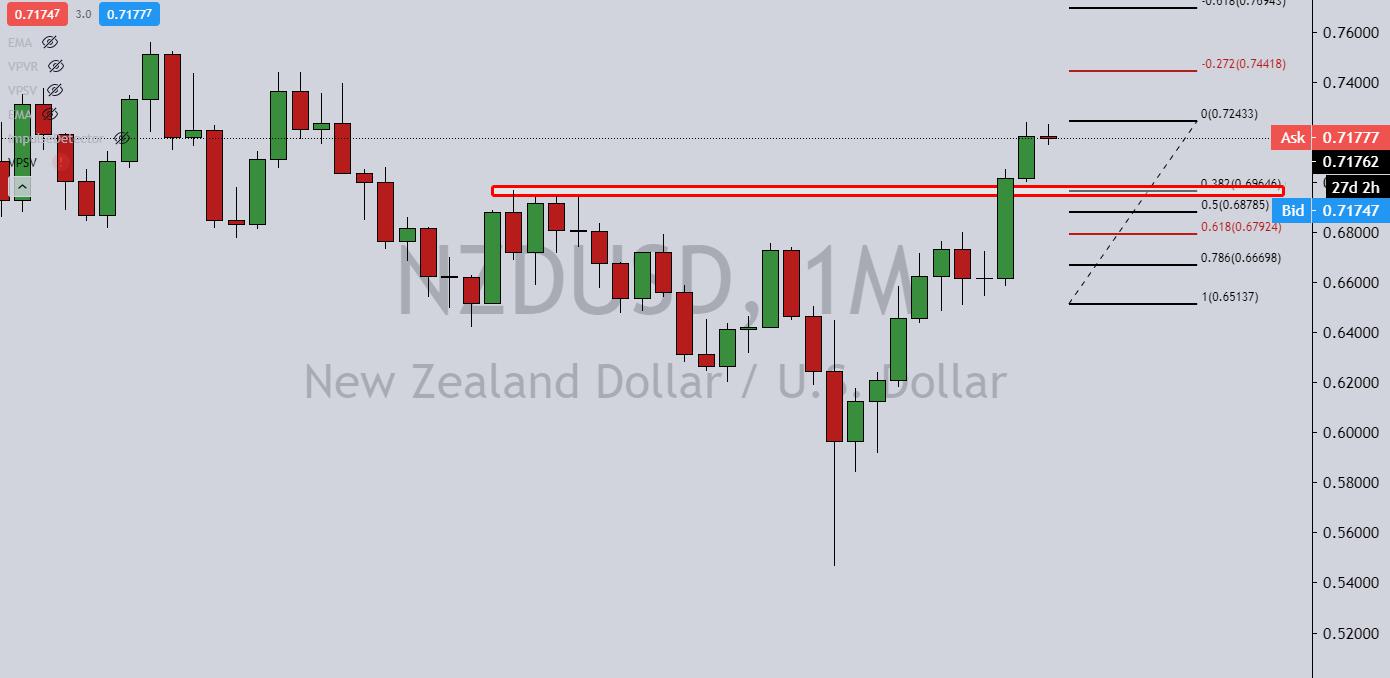
The extended run of the bullish trend could be due to a correction to the 38.2% Fibonacci level and is worth keeping on the watch list.
Weekly chart
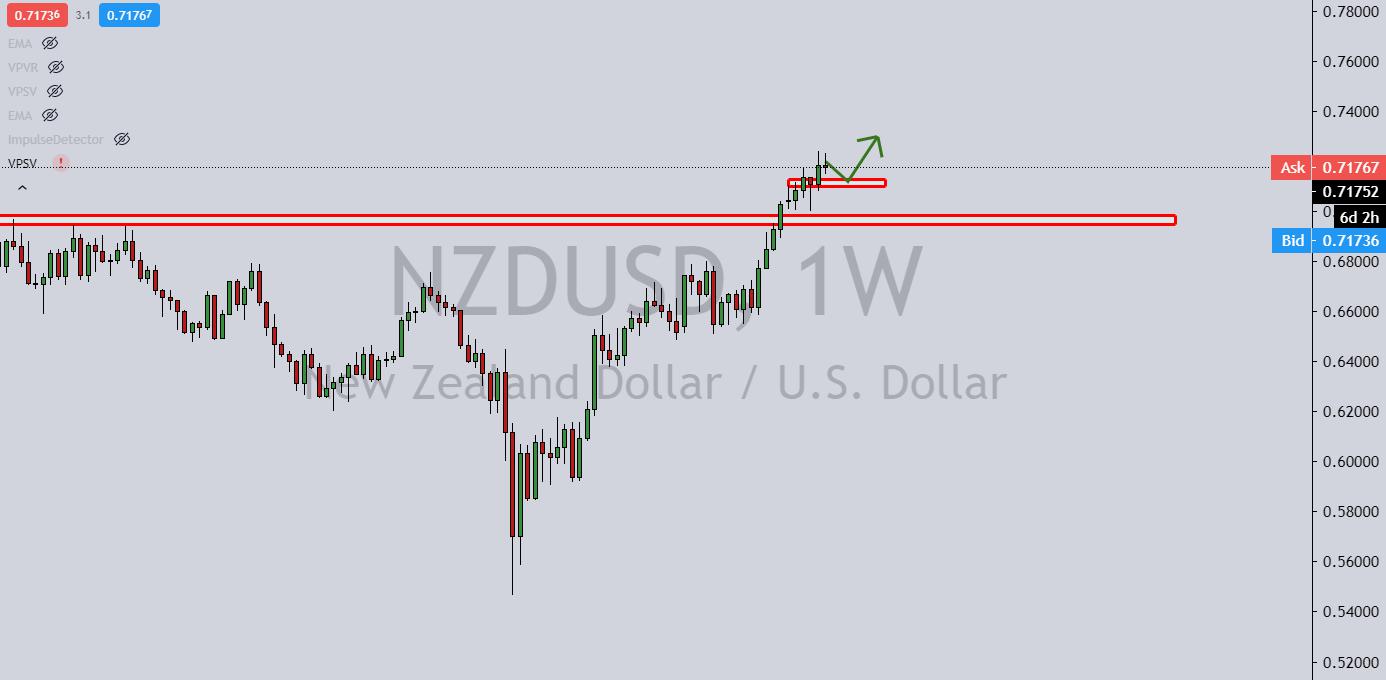
However, the weekly chart shows a strong level of support.
Daily chart
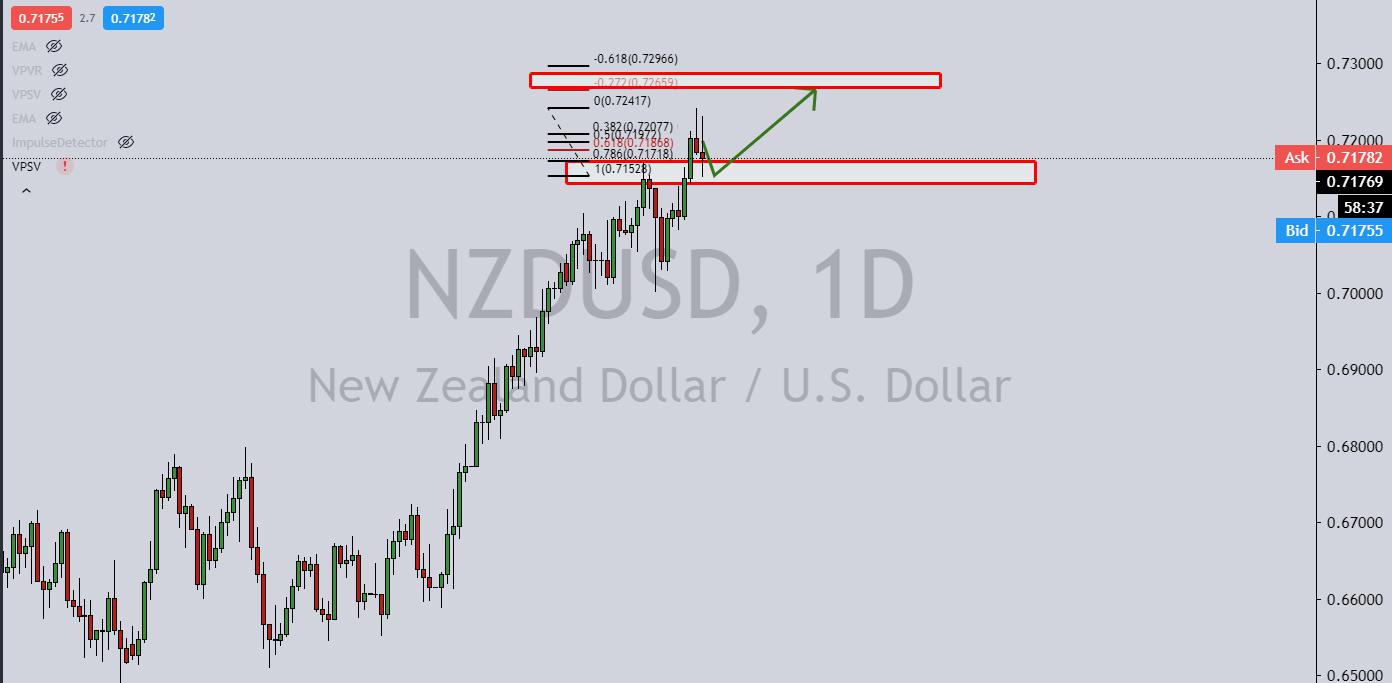
Similarly, if the support holds, then the extended W-formation could prove to show strong support at the prior resistance looking left and be the catalyst for the next upside extension.
Reprinted from FXStreet,the copyright all reserved by the original author.
Disclaimer: The content above represents only the views of the author or guest. It does not represent any views or positions of FOLLOWME and does not mean that FOLLOWME agrees with its statement or description, nor does it constitute any investment advice. For all actions taken by visitors based on information provided by the FOLLOWME community, the community does not assume any form of liability unless otherwise expressly promised in writing.
FOLLOWME Trading Community Website: https://www.followme.com


Hot
No comment on record. Start new comment.