Skewed sentiment likely to prove a major driver of Gold

Markets are open and enthusiastic traders are returning from their Christmas holidays in a good mood, which is poised to affect gold's slumber from the last couple of weeks. The precious commodity, as was anticipated, was mostly trading in a narrow range over set period owing to the low levels of market liquidity. However, this is about to change as trading activity returns to normal.
Gold opened this week's trading session with massive gains, generating 1.55 per cent rally so far into Monday's session, which results from mounted trading anticipation over the weekend. The new year appears to have picked up from where 2020 left off - skewed market sentiment and polarised trading opinions concerning the reeling dollar, continue to represent the most significant determinants of the market's general direction.
This environment predicates the probable emergence of even more volatile price swings, which is quite likely to affect the price of gold. This effect is further going to be bolstered by the action-packed week ahead, with key unemployment and manufacturing numbers being released in the U.S. over the next five days.
Overall, the world's most popular safe-haven asset's price action continues to be greatly affected by strong bullish bias in the short-term. However, the historically low yields in the U.S., coupled with the general market's skewed preference towards higher-risk securities could distort this bullish bias. In other words, there is a certain probability for gold to take a new dive in the near future, which is why today's analysis is dedicated to examining this likelihood.
1. Long-Term Outlook:
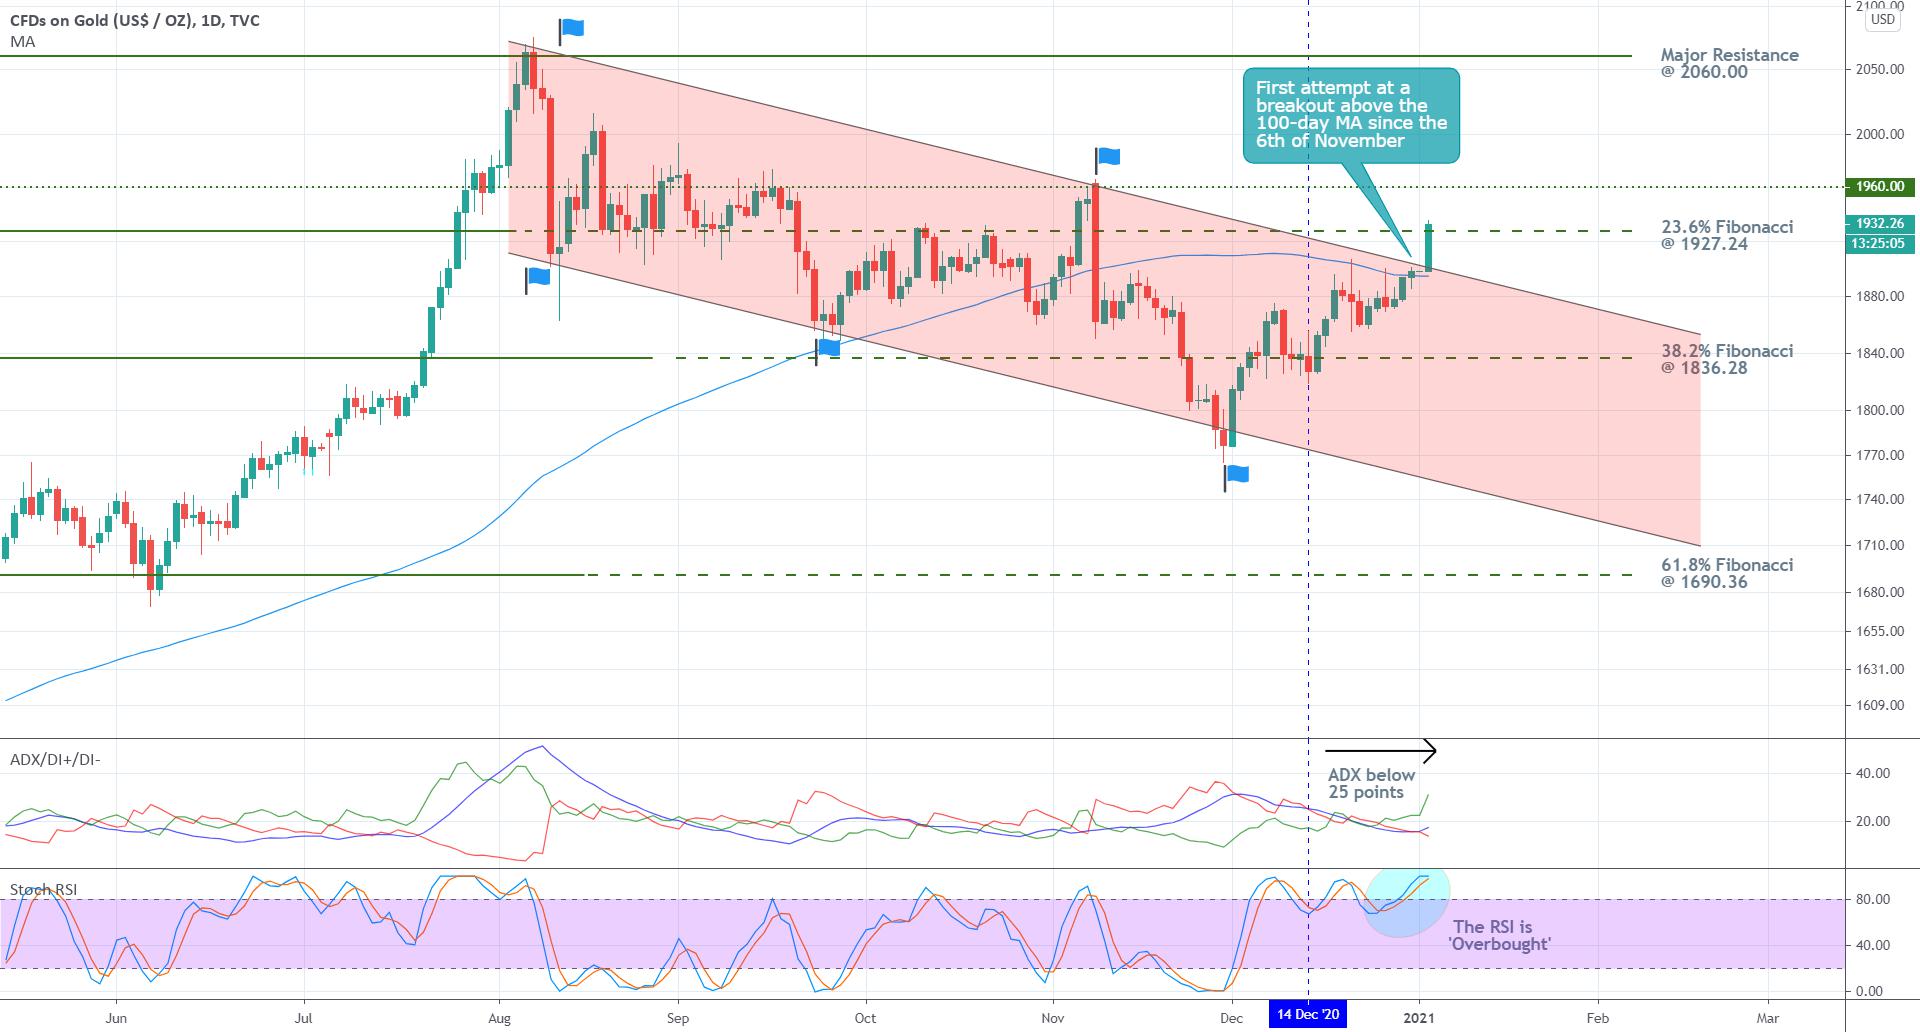
As can be seen on the daily chart below, the price action has been trading in a major descending channel since early-August 2020. On the one hand, this implies the high probability of continued price depreciation in the mid-term. On the other hand, owing to the aforementioned optimism stemming from the beginning of a new year, the timing seems right for breaking this significant downtrend.
In fact, today's attempt at the establishment of a new breakout represents only the third such instance since the beginning of the channel (the flags pinpoint each time the price action reached either of the channel's two boundaries), which means that the market is currently at a crucial make-it-or-break-it point.
In addition to the attempted breakout above the channel's upper border, the price action is also trying to shoot above the 100-day M.A. (in blue); something that hasn`t been achieved since early-November. Finally, the price action is also currently testing the psychologically significant 23.6 per cent Fibonacci retracement level at 1927.24.
Given that the price action is attempting to break all of the three markers in a single sweep, traders should carefully examine its subsequent behaviour as it is very likely to signify the following direction for gold in the weeks to come.
If the price action is to reverse its direction within the next couple of days, this will imply the termination of a fakeout and a probable continuation of the preceding downtrend. After all, the current upswing is part of a broader downtrend, so the likelihood of such a bearish reversal remains quite substantial.
Such expectations are substantiated by the readings of the two indicators utilised on the chart above. The ADX indicator shows that the market is technically range-trading at present, which increases the likelihood of a sudden reversal. It has been trading below the crucial 25-point benchmark since the 14th of December, as a result of the previously mentioned drop in underlying liquidity.
Meanwhile, the Stochastic RSI indicator has been threading in its 'Overbought' extreme throughout the same period, which, given all of the above reasons, could prompt some traders to adverse action, thereby causing a surge in bearish pressure.
2. Short-Term Outlook:
The latest upswing is represented as a 1-5 impulse wave pattern, as postulated by the Elliott Wave Theory, on the 4H chart below. As can be seen, the price action is currently in the process of establishing the final 4-5 impulse leg, which is likely to be followed by a subsequent bearish correction.
The 23.6 per cent Fibonacci seems like the most probable location for concluding the anticipated peak at point 5; hence, traders should be on the lookout for signs of an immediate reversal around the current market price. Nevertheless, a decisive breakout above this psychological barrier could clear the way for another hike towards the next target - the major resistance level at 1960.00.
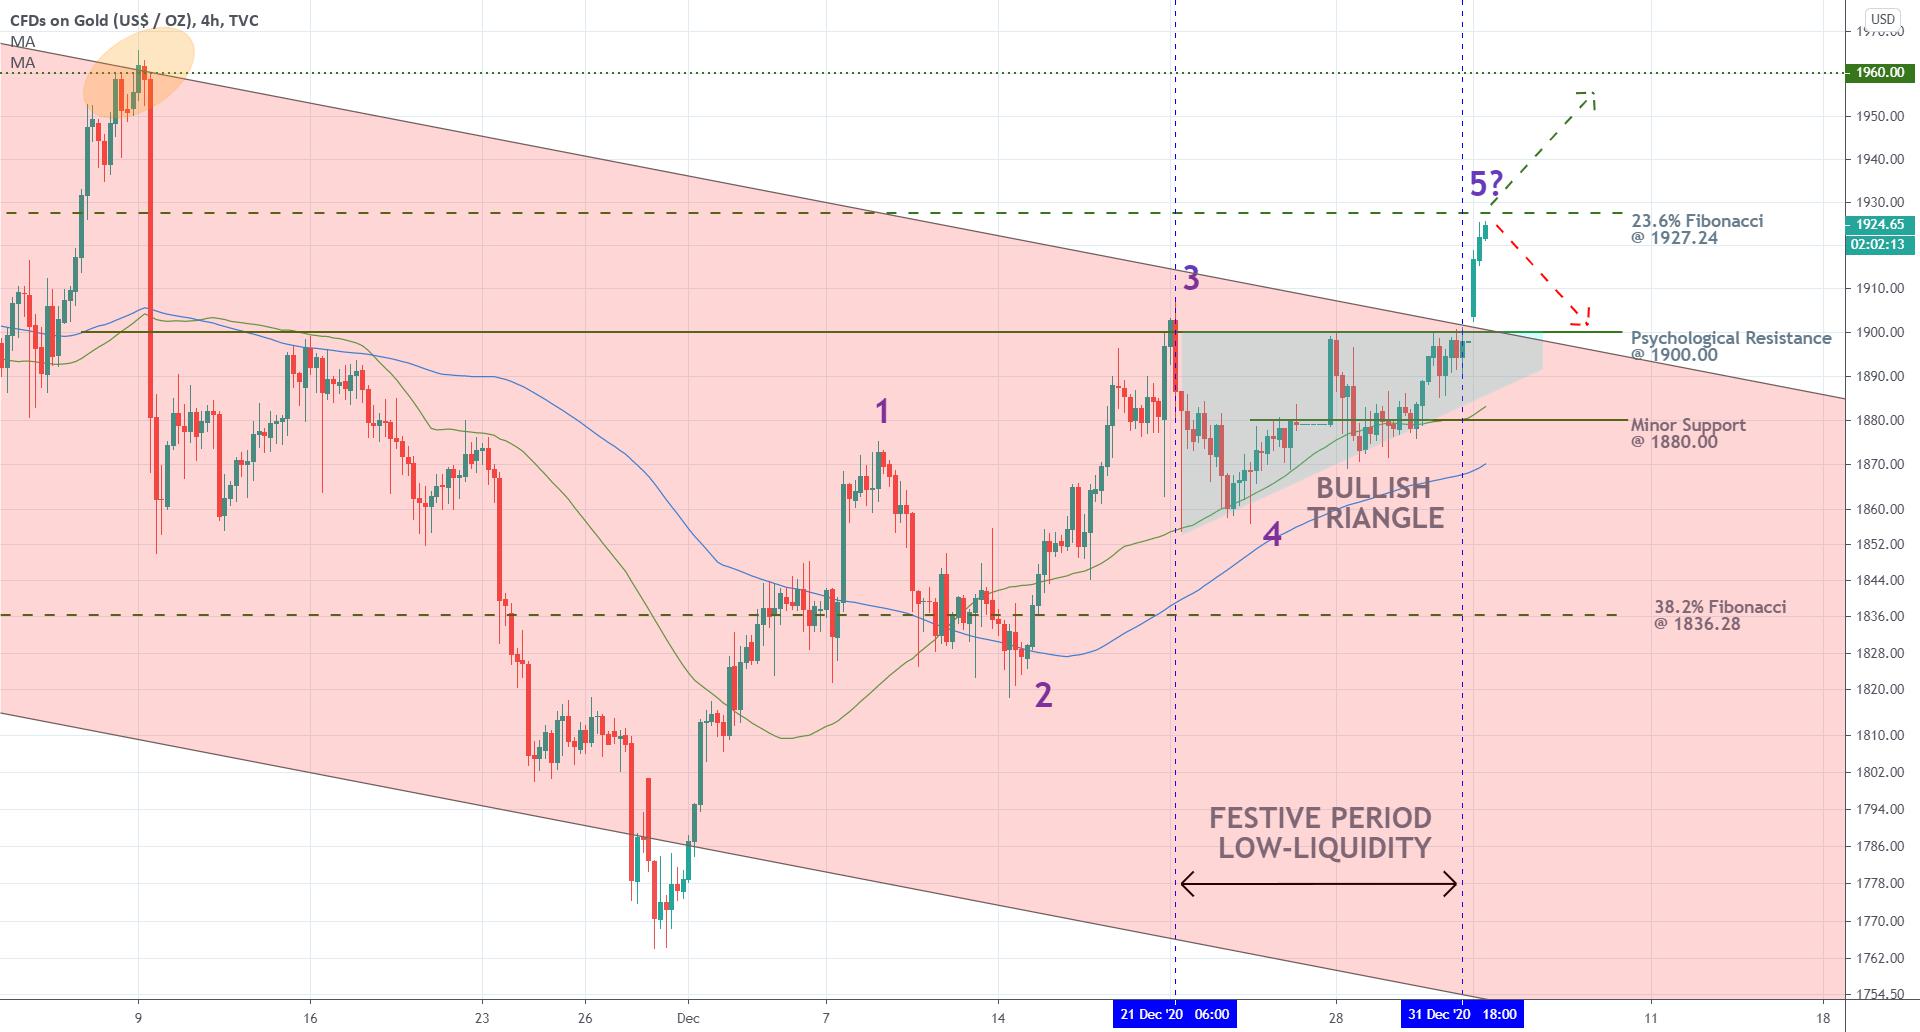
The emergence of a Bullish Triangle pattern between the peak at point 3 and the dip at point 4, also, just below the channel's upper boundary, indicates the possibility for the continuation of the last impulse. Hence, market bears should not rush to sell immediately. At the same time, market bulls who do not already have open buying positions should abstain from entering the market now.
As was mentioned earlier, should the price action manage to break out above 1927.24 categorically, the next target will be the 1960.00 resistance. Conversely, a rebound from the current market price would likely propel the price action towards the psychologically significant support at 1900.00. The next significant target for the market bears would be the 38.2 per cent Fibonacci retracement level at 1836.28.
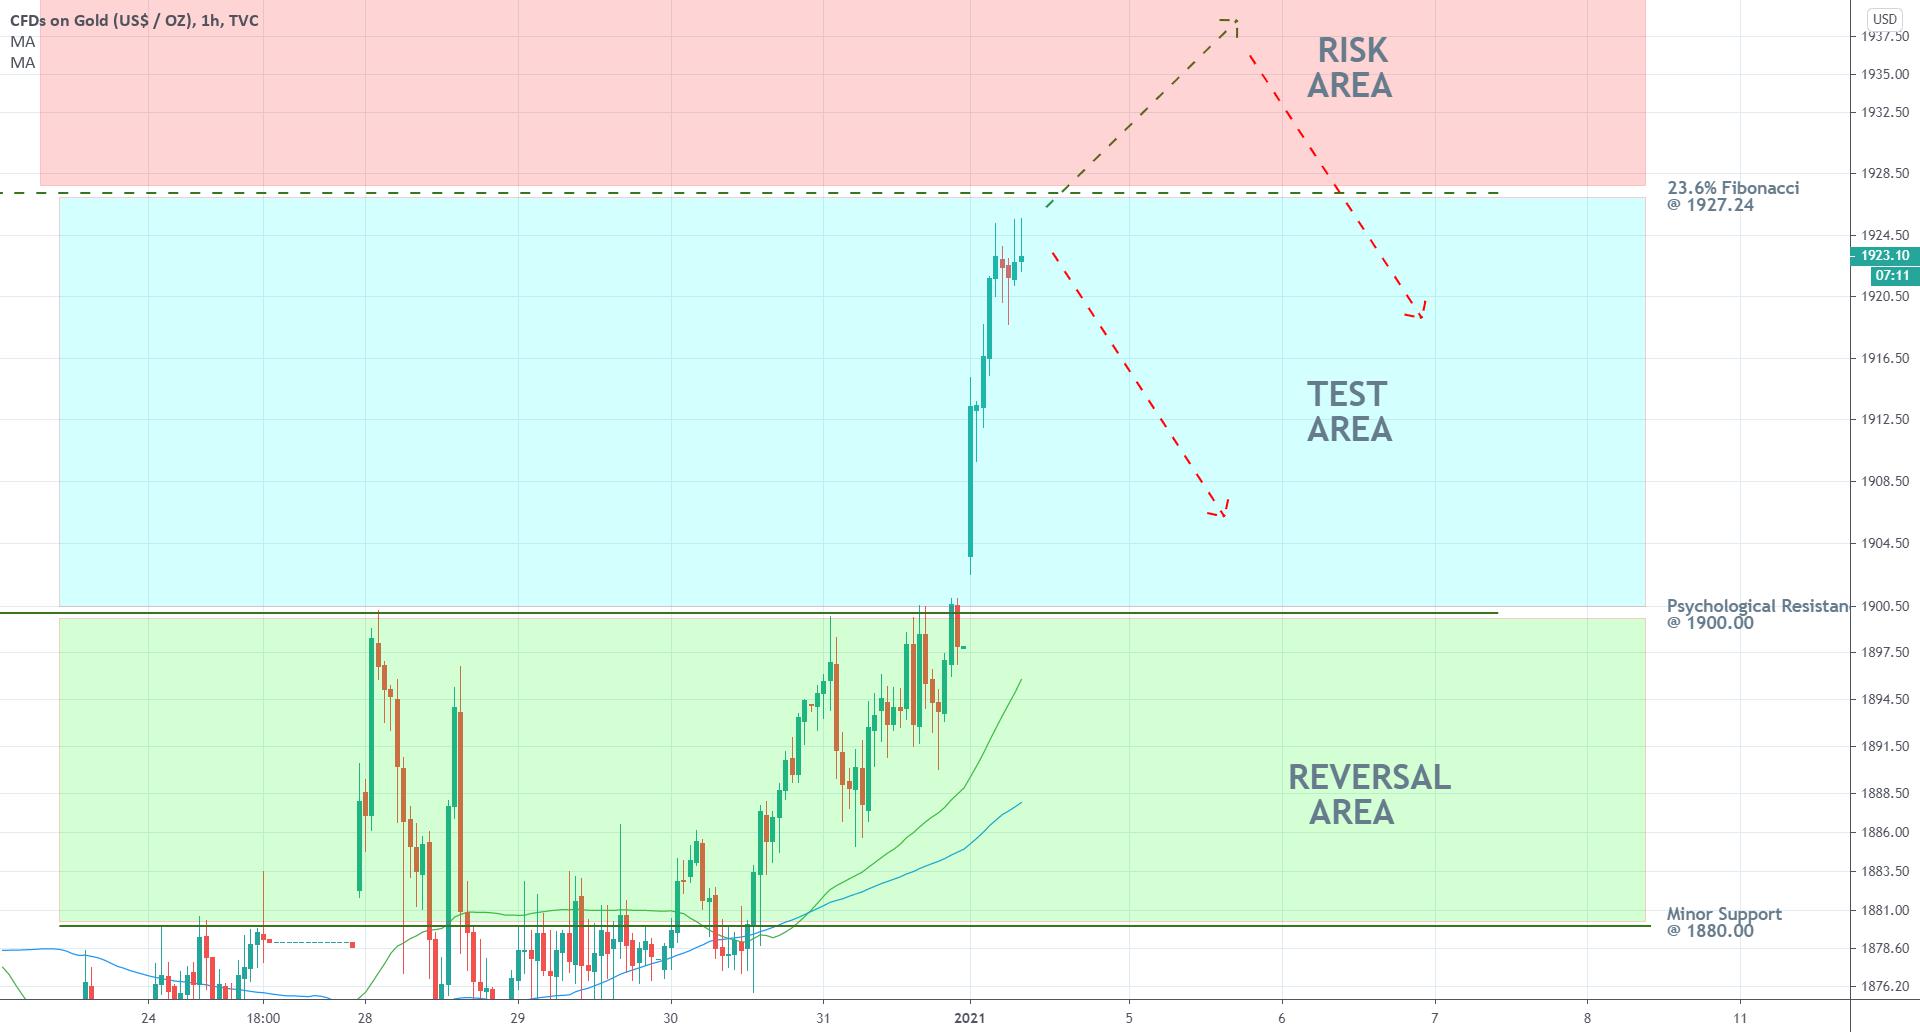
The underlying setup seems favourable for the implementation of both short-term and long-term trading strategies. As regards the opportunities for bears, less risk-averse traders can look for entries around the 23.6 per cent Fibonacci retracement level, on the anticipation for yet another rebound within the aforementioned bearish channel. Such contrarian trading in the short-term can subsequently evolve into trend-continuation trading in the longer-term (as perceived on the daily chart).
Meanwhile, more risk-averse traders can wait and see whether the price action breaks out within the Risk Area, as seen on the hourly chart below. They can then sell gold, provided that the price action reverts itself within the Risk Area. But even if the price action rebounds within the Test Area's boundaries, this would not mean that such risk-averse traders would have missed out on the opportunity. They can still utilise trend-continuations trading strategies after such a reversal.
Regarding the opportunities for bulls, they should wait for the establishment of the next bearish correction before they even consider opening new positions. That is so because going long now on an already developing upswing entails a high degree of risk from sudden reversals. They can instead wait for an opportunity to go long around the 1900.00 support, provided that the price action shows definite signs of consolidation above this psychological barrier.
3. Concluding Remarks:
The most important thing to keep in mind is that while the price action is currently trading in a bullish upswing, as perceived on charts with lower timeframes, the prevailing market trend remains effectively bearish. Volatility is expected to rise markedly by the end of the week, which would most definitely affect the price action's short-term behaviour. Overall, the market bears seem likely to regain control by the end of the week.
Reprinted from FXStreet,the copyright all reserved by the original author.
Disclaimer: The content above represents only the views of the author or guest. It does not represent any views or positions of FOLLOWME and does not mean that FOLLOWME agrees with its statement or description, nor does it constitute any investment advice. For all actions taken by visitors based on information provided by the FOLLOWME community, the community does not assume any form of liability unless otherwise expressly promised in writing.
FOLLOWME Trading Community Website: https://www.followme.com


Hot
No comment on record. Start new comment.