Top commodities technical analysis forecast 2021

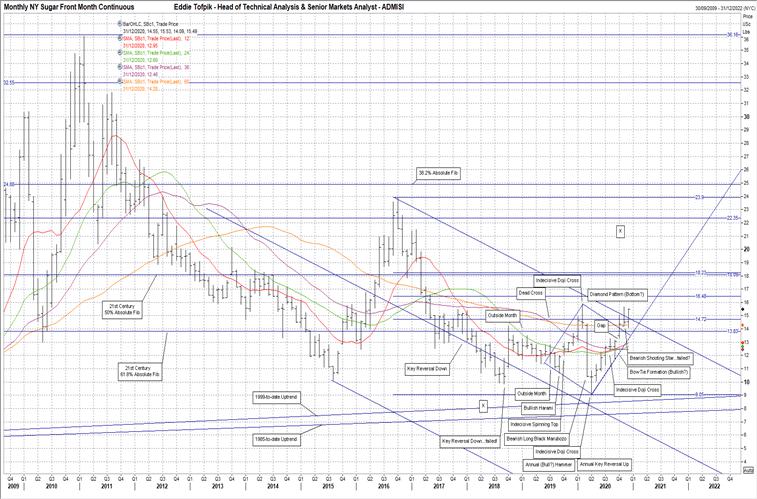
Sugar
In 2019 the market switched from the 2011 – 2016 Bearish Andrews Pitchfork to the shallower Bearish Schiff Pitchfork. In 2020, the last two months in point, it looks like the market is disposing of the Bearish Pitchforks all together as in November the market breached the Upper Tine (currently 14.83) and in December we saw a close clear over it. The Middle Tine (currently 6.71) had in its time been a pretty good indicator of the Bearish angle of attack since 2017. However, 2019 also set the scene for its possible retirement with an Annual Bull Hammer Pattern as it started a move away from the Middle Tine and a significant distance to- wards the Upper Tine. Whilst this carried on into early 2020 and set new highs not seen since May 2017, it did not in fact test the Upper Tine. It all ended with an Indecisive Doji Cross at what turned out to be a high for the market…at least for early 2020. The move down was vicious, a Bearish Long Black Marubozo, the longest month since mid 2016! However, just as it looked like we may see a further decline towards the old Target ‘X’ from 2016 – 2018’s possible Bear Flag, the market halted in April with another Indecisive Doji Cross…but on the downside! I suppose part of this halt can be attributed to the Middle Tine below. However, I am minded to think that the market’s proximity to the significant 1999-to-date Uptrend (currently 8.56) and the even more significant, if not as close, 1985-to-date Uptrend (currently 7.63) had a lot more to do with this reversal back up. Whichever was the cause, this set up a rise that has continued through the remainder of 2020…and set in place two important Patterns for the future. First, let us look at what the market has achieved these last few months. We have consecutive closes over the One Year MA (currently 12.95), the Two Year MA (currently 12.66), the Three Year MA (currently 12.46) and most importantly, rising consecutive closes over the Five Year MA (currently 14.28). Additionally, over the last three months the has punched higher, gapping higher indeed, over the 61.8% Fib of the 21st Century Fib at 13.83. In December, just as the year ended, the market made its highest close since April 2017. This has also led to a potentially major Bullish action, an Annual Key Reversal Up for 2020. Now we come to the two most important Patterns that have evolved over the past few months. Firstly, the action in from Q3 2017-to-date with its peaks and troughs has led to the formation of a Diamond Pattern. Right now it looks Bullish…but beware of false breaks on this one. If however, it continues to be a genuine Bullish Diamond Pattern then a potential Target ‘X’ would be in the 21.40 area. Please note, this is a multi year Pattern…do not expect it in the next weeks or months…unless it really wants to! The Lower Diamond Uptrend (currently 13.23) is the one to watch on any journey higher, this has and will dictate and moves upwards. Secondly, in September we had a Bow Tie formation of the MAs. Currently it looks superficially Bullish. However, the MAs involved, the Two Year, the One Year and the Three Year MAs went into it in the wrong order. Nevertheless, this is potentially a very Bullish indicator for the future as it would suggest a significant action, potentially Bullish, in the next 15 – 20 months. That is somewhere between March 2022 – July 2022. This is something to place in a future diary or note on a future calendar….assuming it plays through! Finally, we have two MA’s pointing Up and two Sideways. With all the previous actions and potential actions plus the movements in the MAs, I think it appropriate to move the bullet point away from mildly Bearish.
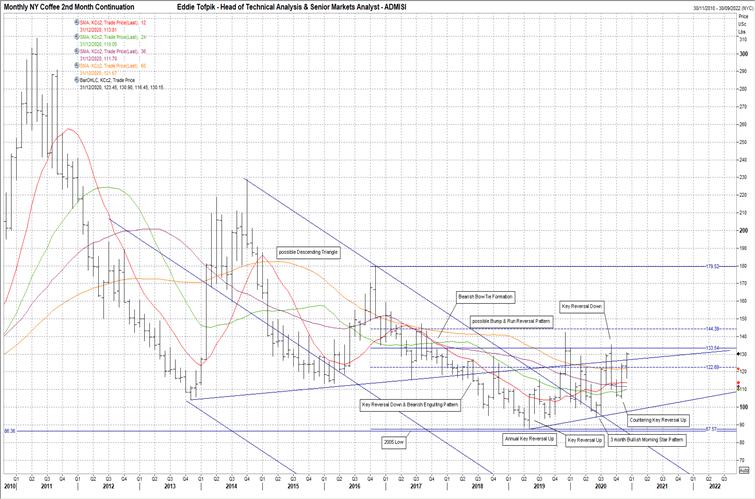
Coffee
I wrote the following in my last Annual commentary back at the start of 2020. ‘I could write many things here…I probably will in the end…but the key thing or things to bear in mind as they are related is that the Monthly Key Reversal Up seen in May (2019) that was effectively a rejection of the 2005 low at 86.35 was the cause of what eventually became an Annual Key Reversal Up in 2019.’. I wrote this as we ended 2019 above all the MAs and stalling just under the 2016 – 2019 50% Fib at 133.55. The optimism for a further follow through higher was misplaced as prices dropped back down through all the MAs and closing below them all as well as the broken Upper Tine of the 2011 – 2014 Bearish Schiff Pitchfork that had shown the way lower since 2017. Indeed, this Up- per Tine continued to show the way as prices slide along the topside of the broken Upper Tine as a descending bottom and utilising the Five Year MA (currently 121.65) as a closing based cap on the market. This all carried on until August which saw the Bullish result of the previous three months build-up of a Bullish Morning Star Pattern that once again in September tempted the 50% Fib at 133.55. However, September proved to be a false move higher as pric- es turned and dropped down again, not as big a move…but nevertheless still a Monthly Key Reversal Down. We saw a follow on lower into October and early November. However, this time the drop was tempered as November became a Countering Key Reversal Up with a follow on higher into December that made the highest close of 2020 and made the year an Annual Bullish Doji Cross that was just about an Annual Bullish Dragonfly Doji as well. So where does this leave us? Well…the next dominant Pattern after the previously mentioned Bearish Schiff Pitchfork is the 2014 – 2019 possible Descending Triangle. Now DTs have a preference to be historically Bullish, which was why it was surprising, though perhaps not wholly unusual, to see the market break out lower out of this Pattern in mid 2018 making a new low and testing but rejecting the 2005 low at 86.35. The failure to follow through lower after this can now ques- tion whether the whole move from mid 2018 – 2020 may have been a false break lower. If so, it is a big false break…but I have seen similar elsewhere that have turned back up after such a duration on the Charts. However, I’d caution that we have been here before, over the extension of the Uptrend of the Bullish DT (currently 126.75). As recently as August – September in 2020 and a little earlier between December 2019 – January 2020 we saw the same…each failed! Yet, I would add that the consistent attempts higher may be having some attrition upon the overhead 50% Fib resistance at 133.55, especially on a closing basis. It is now up to January and February’s action of 2021 to show if this attrition has had any significant effect. One final point, I highlighted last year the following ‘Finally, there is the possibility, just the possibility, that the action since the drop back in 2016 could be a type of Bump & Run Reversal Pattern. It looks very much as if it could be…but it is early…so watch carefully!’. 2020 has done everything it could to stymie that B&RR Pattern…and for the most part it has been effective. However, it has not killed off the idea. I still think we might just have such a Pattern! We’ll just have to see. With three out of four MAs flatlining and one MA only rising gently, I feel obliged to draw in the bullet point above from last year’s mildly Bearish into Neutral for this year.
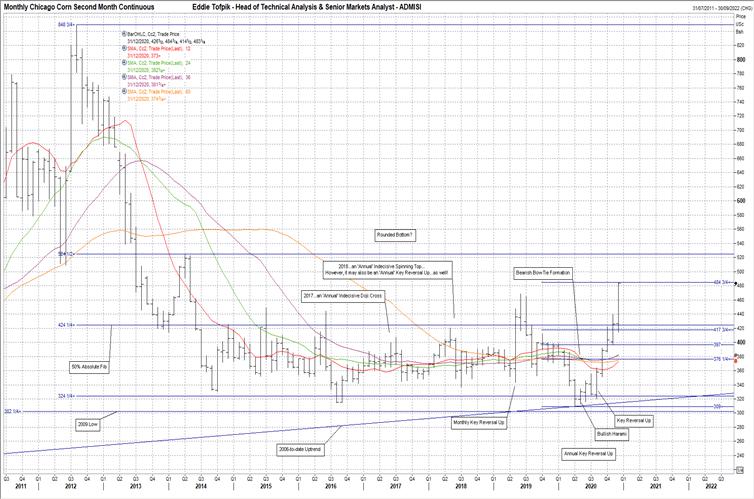
Corn
I have taken to writing in recent years how little the price has relatively moved here on a year-on-year basis. It has been satisfying as well as descriptive on how little prices had ventured since last 2014. This has changed completely since this time last year. To look at this it is best perhaps to look at my explana- tion of the then bullet point above I’d made a year ago, thus ‘Last time I’d moved the bullet point above into mildly Bullish as I had seen the build up of forces ready to move the market higher. This has now happened and apart from the passive Uptrend (2006-to-date…since reassigned slightly lower and currently 314), there is no overt build up or attempt to gain ammunition seemingly in current operation. ALL the MAs are corralled between about 377 – 392 and whilst there may be a nascent Bullishness to them, I’m not that convinced of it having legs. Hence, whilst I’ll maintain the mildly Bullish bullet point above…I am not necessarily that keen upon it.’. They part I’d like to look at first is the maintenance of the mildly Bullish bullet point for a further year…but my being ‘…not necessarily that keen upon it.’. You can see in that that how the 50% Absolute Fib at 424 was an obstacle to the way higher as well as the severe con- gestion of MAs (now 373 – 382) that was at the market levels. It was therefore no surprise to see the first part of 2020 with lower prices, reassigning as I have already mentioned, the 2006-to-date Uptrend. The key level to note in this was the 2009 low at 302…with a little help from the 38.2% Absolute Fib at 324. This caused a turnaround back up with the signal being the Monthly Key Reversal Up in August. This time it seems, the 50% Absolute Fib at 424 was not going to be a cap with two consecutive closes over it…though I would prefer another to be sure as the one in November barely rolled over the 50% Absolute Fib. It is nevertheless the seeming beginnings of a Rounded Bottom of sorts…definitely not the prettiest of such Patterns that I’ve ever seen, hence some hesitation until I can start giving Targets for any move higher…but still exhibiting appropriate behaviour for such a move. The next obstacle topside, assum- ing it carries on, will be the 61.8% Fib at 524 which conveniently ties in with the first break point to such a pattern as it was the 2014 high. It very much de- pends on what January and February will bring to this market now. Then of course there’s the fly in the ointment! In May the market made a Bearish Bow Tie Formation of the One Year MA (currently 373), the Two Year MA (currently 382) and the Three Year MA (currently 382). This is a longer term Formation, but it still contras the more recent Bullish action. Nevertheless, based on the Bow Tie you might expect a Bearish action in 15 – 20 month time…or in between August 2022 – December 2022. I feel obliged to point out that since October, the MAs have all turned higher, some sharply! So…looking at the recent MAs and how they are all pointing higher, you would expect me to move the bullet point above a further notch into the Bullish side to fully Bullish. Not so… and I’ll explain why! Normally, going fully Bullish is what I would look to do. However, I’ve seen similar behaviour in the MAs back in June 2019…and that ended with a drop in the months following back below all the MAs. Hence, in this case, I will maintain the mildly Bullish bullet point because of my natural caution…though tinged with optimism that moves higher may be strong and plentiful…perhaps!
Download The Full Review of Commodity Markets
Reprinted from FXStreet,the copyright all reserved by the original author.
Disclaimer: The content above represents only the views of the author or guest. It does not represent any views or positions of FOLLOWME and does not mean that FOLLOWME agrees with its statement or description, nor does it constitute any investment advice. For all actions taken by visitors based on information provided by the FOLLOWME community, the community does not assume any form of liability unless otherwise expressly promised in writing.
FOLLOWME Trading Community Website: https://www.followme.com


Hot
No comment on record. Start new comment.