US Dollar Index Price Analysis: Next stop at 89.22

- DXY regains extra selling pressure near 89.40.
- Next on the downside emerges the April 2018 low near 89.20.
The index starts the new year on the negative side and extends the drop to fresh lows in the 89.40 region.
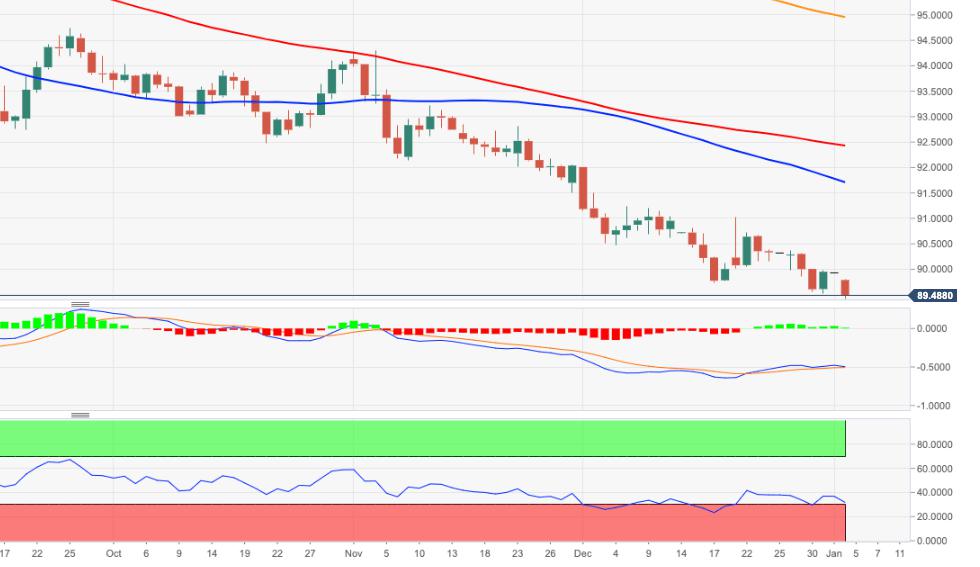
The outlook for the dollar appears well into the bearish territory and therefore further losses remain well on the cards. That said, the next support of relevance comes in at 89.22 (April 2018 low).
The downside pressure is expected to mitigate somewhat on a breakout of the 2020-2021 resistance line, today around 91.80.
In the meantime, as long as DXY trades below the 200-day SMA, today at 94.94, the negative view is forecast to prevail.
DXY daily chart
Reprinted from FXStreet,the copyright all reserved by the original author.
Disclaimer: The content above represents only the views of the author or guest. It does not represent any views or positions of FOLLOWME and does not mean that FOLLOWME agrees with its statement or description, nor does it constitute any investment advice. For all actions taken by visitors based on information provided by the FOLLOWME community, the community does not assume any form of liability unless otherwise expressly promised in writing.
FOLLOWME Trading Community Website: https://www.followme.com


Hot
No comment on record. Start new comment.