Top currency pairs technical analysis forecast 2021

EUR/USD
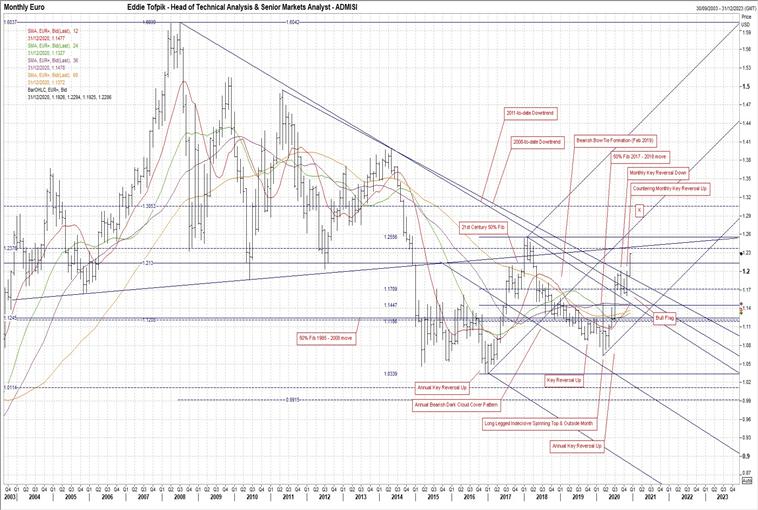
WHAT an interesting year it has been! Four years ago (2017) we had an Annual Key Reversal Up. This was followed three years ago (2018) with a countering Annual Bearish Dark Cloud Cover Pattern. In 2019 that left us with a sort of follow on lower that extended out into the 1 st Quarter of 2020. Prices broke down through and closed below, over many months, all the MAs and the recent 50% Fib at 1.1447 and importantly, the super significant 50% Fib o f the key 1985 – 2008 move at 1.1245. However, things started to change during March 2020 when we had a hugely significant Long Legged Indecisive Spinning Top…almost a Doji Cross…that was also an Outside Month. Interestingly, the market’s top in March was at the combination of the 50% Fib at 1.1447 and the 3 Year MA (currently 1.1478). Anyway, from that point onwards and through the summer, the market started to move on up. Through the 50% Fibs at 1.1245 and 1.1447 plus u p through all the MAs. In July the market made not only a big move higher but also punched up through and closed over the Upper Tine (currently 1.1488) of the B earish 2014 – 2018 Schiff Pitchfork that had shown the way lower since 2018. In September, the first Bearish month showed itself, a Monthly Key Reversal Down. Th is was no doubt prompted by the moves higher up over the 2008-to-date Downtrend (currently 1.1688) and the not too far distant 2011-to-date Downtrend (currently 1.1910). During October it looked like this might be the start of a reactionary move back down. However, the nearby support of the Broken Upper Tine of the Bearish Schiff Pitchfork as well as the 3 Year MA and 50% Fib at 1.1447 halted any attempt to move lower and resulted in November making a Countering Monthly Key Reversal Up AND the formation of what looks like a possible Bull Flag this year. This would give a potential Target ‘X’ in the 1.3000 area. Now…before we get all get carried away, there are some things to consider topside and also longer term. Admittedly, this month has seen a clear close over all the Downtrends plus t he key 21st Century 50% Fib at 1.2130. Yet we have three obstacles on the way further higher. Firstly, the Neckline of the mutated H+S Top formation formed from 200 3 – 2014 (currently 1.2390). This is probably the most significant resistance as though it has been breached before, there was no two consecutive month ’s closes over it. It is a big Bearish factor that is already close tow twenty years long and it would fit in with the Top pattern if it was reje3cted and prices moved lower. Next is the high from February 2018 at 1.2556. Not hugely a major feature compared to the previous one …but close enough that it may influence it. Thirdly is perhaps the weakest. The rising Middle Tine (currently 1.2652) of the newly drawn Bullish 2017 – 2020 Andrews Pitchfork. This is a tempering feature and one that is rising towards Target ‘X’ each month. There is one other thing I’d like you to consider and it is something I wrote last year at this time ‘Finally, I made note last year (2018) of the possibility of a Bow Tie formation with all the MAs moving closer. This actually happened in February (2019)…though the order of entry and exit of the MAs is in the wrong order.
Nevertheless, the action of the Bow Tie appears Bearish and with this one can look for the kick-in to the Pattern between May – October of this year…so watch out for that!’. May – October did indeed see an action…and a large one…though what appeared to be Bearish turned out to be Bullish. Last year I had the bullet point above in a mildly Bearish stance. This time we have all three MAs pointing up…though with limited incentive in one particular case. With this in mind, I ’m minded to move the bullet point into Bullish…yet still with a question mark.
GBP/USD
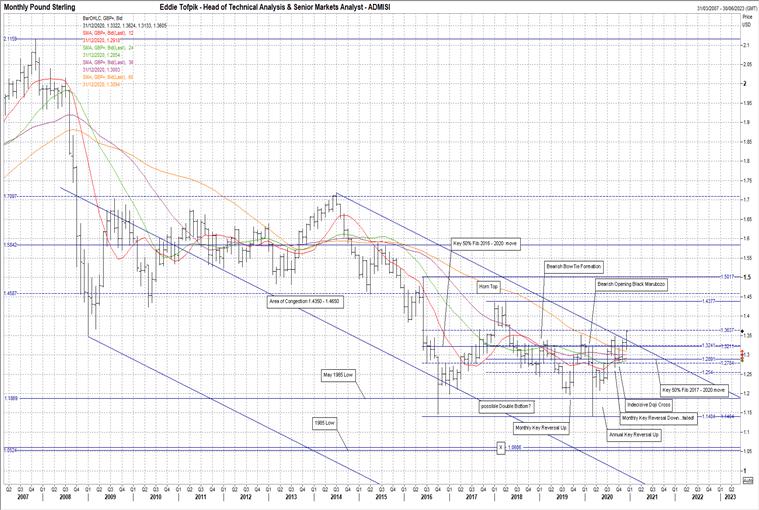
I have written for many years how the Long Term Bearish Schiff Pitchfork from 2007 – 2014 has been running this pair. I even had a Target ‘X’ in the 1.1605 area, just ahead of the 1985 low at 1.0525. However, a Monthly Key Reversal Up in September 2019 looked as if it might stymie the whole situation. Yet this was halted soon after we started 2020 as the 5 Year MA (currently 1.3094) capped the rise …and then…and then we had the big move down in March that tested not only the May 1985 low at 1.1869 but also the more recent 2016 low at 1.1450 all wi th the same month. The test lower seem to have been a final attempt down to Target ’X’ as soon after prices started to climb, up through 50% Fibs and MAs. Apart from March and December (I will deal with December shortly) the key month was September when the market rose enough to challenge the Upper Tine (currently 1.3390) of the same previously mentioned Long Term Bearish SP. It was an interesting test as it sho wed up as a Monthly Key Reversal Down, something that is noteworthy as one would have reasonably expected to see a follow on lower in the following month(s)…but we did not! Instead we had an Indecisive Doji Cross in October and a move back up in November. I suspect it was the failu re, despite moving below during the month, of a Monthly close below the newly reassigned 50% Fib of the 2017 – 2020 move at 1.2891. I would add that the conflux of MAs in the region and the other newly reassigned 50% Fib of the 2016 – 2020 move at 1.3211 may have had a strong attrition effect upon the move as well. All this gradual move led to perhaps the biggest move so far in 2020, even taking into account March, the break up and close over the Upper Tine of the Bearish SP. The question now is whether the market will exploit this move higher? We have overhead a lesser 61.8% Fib at 1.3637…but then nothing until the 2018 highs at 1.4344 and 1.4376…or so it seems! Closing back below the 50% Fib at 1.2891 would ‘stymie’ this move higher. I would like to add one final item. I wrote at this time last year ‘Here, as it has been in EURUSD, we have a Bearish looking Bow Ties formation of the MAs formed back in February 2019. The order is wrong…but that being said it is worth looking out for the potential kick-in for the Pattern between May – October this year (2020).’. This…as in EURUSD…saw some action in between May – October… though not in comparison on a relative scale compared to March 2020’s action. However, what appeared to be Bearish turned out to be Bullish. Last year (2019) I had the bullet point above in a Bullish stance with a question mark. This time, looking at the MA ’s I would keep it so given how the MAs look. However, we may be on the first step to a stronger Bullish stance, it all depends on what happens now that we h ave closed over the Upper Tine.
EUR/GBP
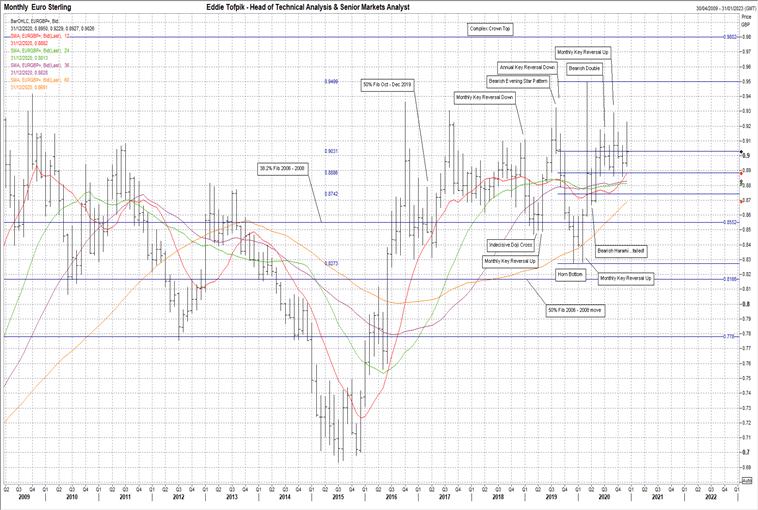
The first thing to note here is that despite the very large range in 2020, we still had neither an Annual Key Reversal nor a lesser Annual Outside Year. On a fractal basis, we did have Monthly Key Reversals Up in February and also September…but nothing for the year. The move up during 2020 comes as a disappointment to those who followed the 2019 Annual Key Reversal Down. However, to those who sought support from the 5 Year MA (currently 0.8691) and the subsequent Monthly KR UP in February that led to a Horn Bottom over the turn of the year into 2020, they were proved right this year. Then there’s what happened in March! A massive range that saw the first of many closes over the MAs as well as the expansion of the topside range…though not by as much as would be endured. The market did indeed break up through the 2016 high at 0.9365 and on the face of it by a reasonable margin. However, the move up was not sustained and the next Monthly KR Up in September was back to limiting itself to the previous 2016 high. That all being said, the market still seems to wish to try higher. They are tentative moves…but for now they still seem to be what is going on. Personally, I would not be surprised at a rounding action similar to late 2018… but I do note how the market has managed to stay well over the MAs…all of them…since May and for the most part well over the recent 50% Fib of the late 2019 – early 2020 action at 0.8886, I’m not overly keen on that one as well. I would only echo the following from my commentary last year at this time when looking at the downside ‘Of course it is completely pointless unless we can break the key 50% Fib of the 2006 – 2008 move at 0.8166.’. We currently have two MAs rising, including the Five Year MA, the Three Year MA gently moving higher and the Two Year MA flatlining. This would suggest moving the bullet point above back into mildly Bullish…where it was back in 2018.
Download The Full Review of FX Markets
Reprinted from FXStreet,the copyright all reserved by the original author.
Disclaimer: The content above represents only the views of the author or guest. It does not represent any views or positions of FOLLOWME and does not mean that FOLLOWME agrees with its statement or description, nor does it constitute any investment advice. For all actions taken by visitors based on information provided by the FOLLOWME community, the community does not assume any form of liability unless otherwise expressly promised in writing.
FOLLOWME Trading Community Website: https://www.followme.com


Hot
No comment on record. Start new comment.