The weekly market brief: SP&500 at all-time market highs

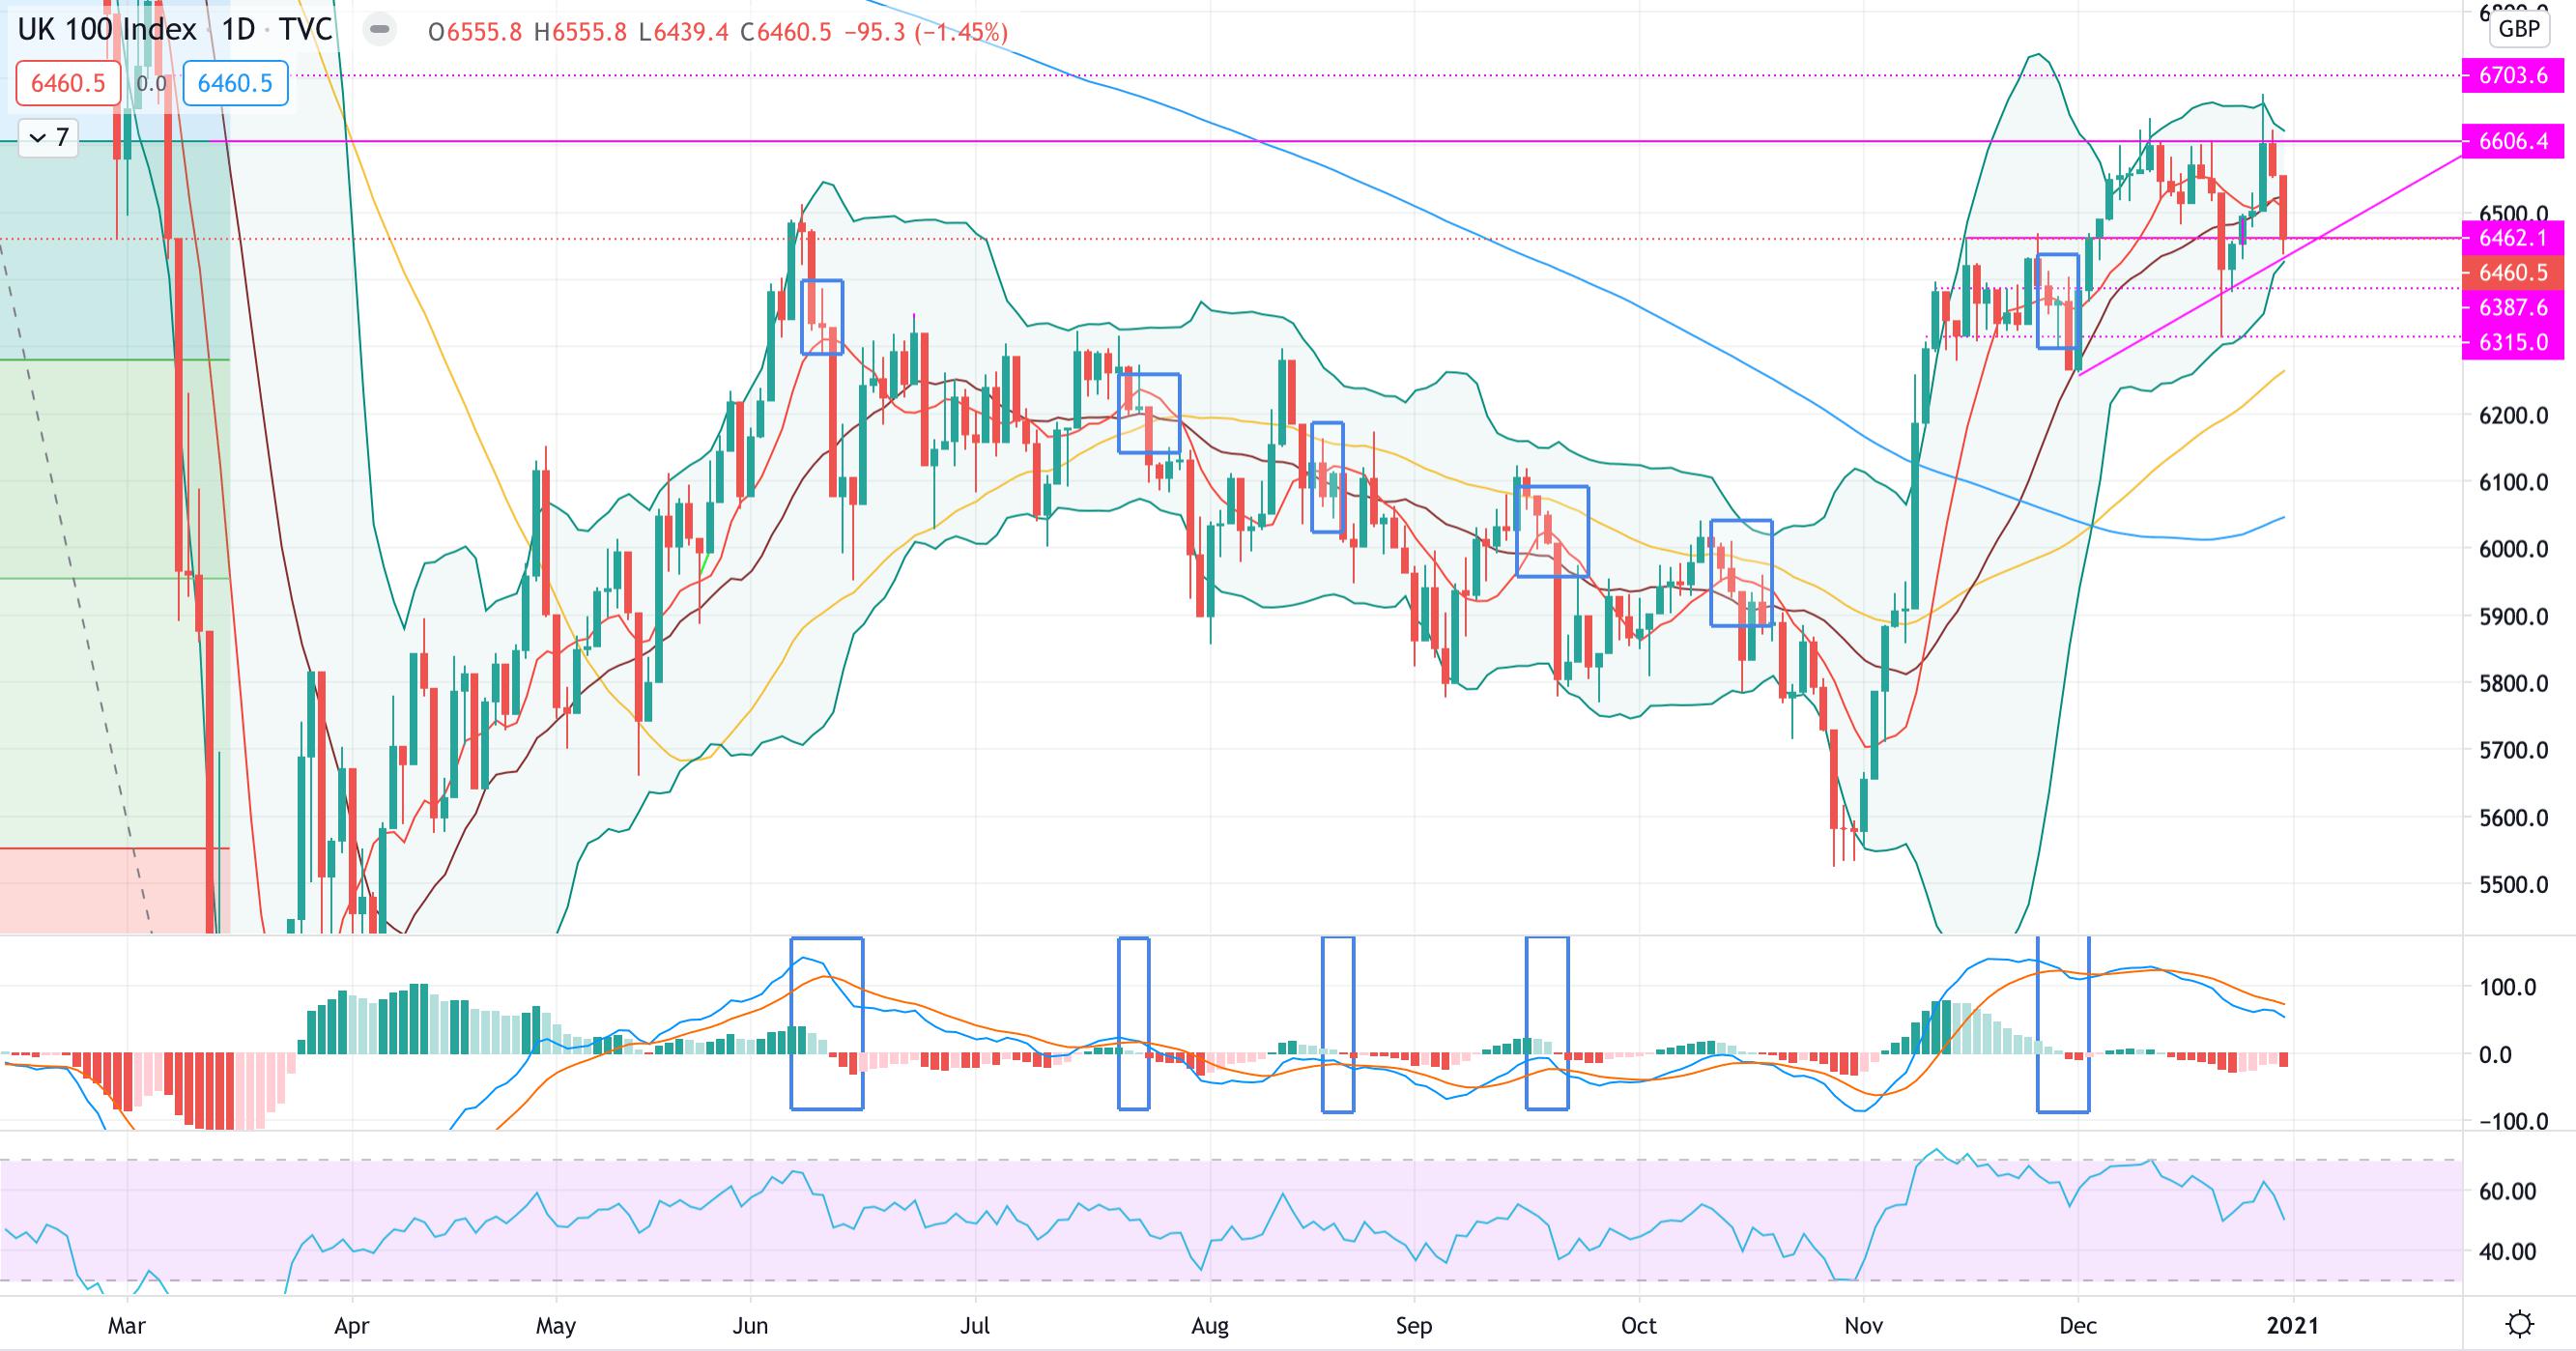
FTSE 100 (#UKX)
The FTSE had a very short week, 3 trading days, and did not move much from last week closure.
On Monday the #UKX, like other major markets, were pumped up by stimulus check talks in the US. The Index almost reached the level of March 2020 before slowly coming down.
From a technical perspective, we see how the #UKX keeps trading within the major area of support and resistance.
The MACD, however still above 0, is pointing to the downside together with a RSI at 50.
Compared to last week, we can see how the 50MA keeps rising making the level of support at 6,315 stronger.
In order to have a better idea of where the market might be heading next, we can draw a line from 1st December where we can see how the market is forming an ascending triangle.
In regards toit, if the trend line gets broken or keep trading sideways can be interpreted as sign of exhaustion and move to the downside are likely.
On the contrary, moves to the upside are possible if the index will quickly break the resistance level.
For the coming week, we expect at first the index to slightly bounced back to the upside but then keep trading almost sideways: the two strong bearish candles that closed the week might be an early indicator of moves to the downside.
If the support level at 6,462 gets broken, the next levels to consider are 6,462 - 6,315
At present, we confirm resistance at 6,606 and support at 6,462.
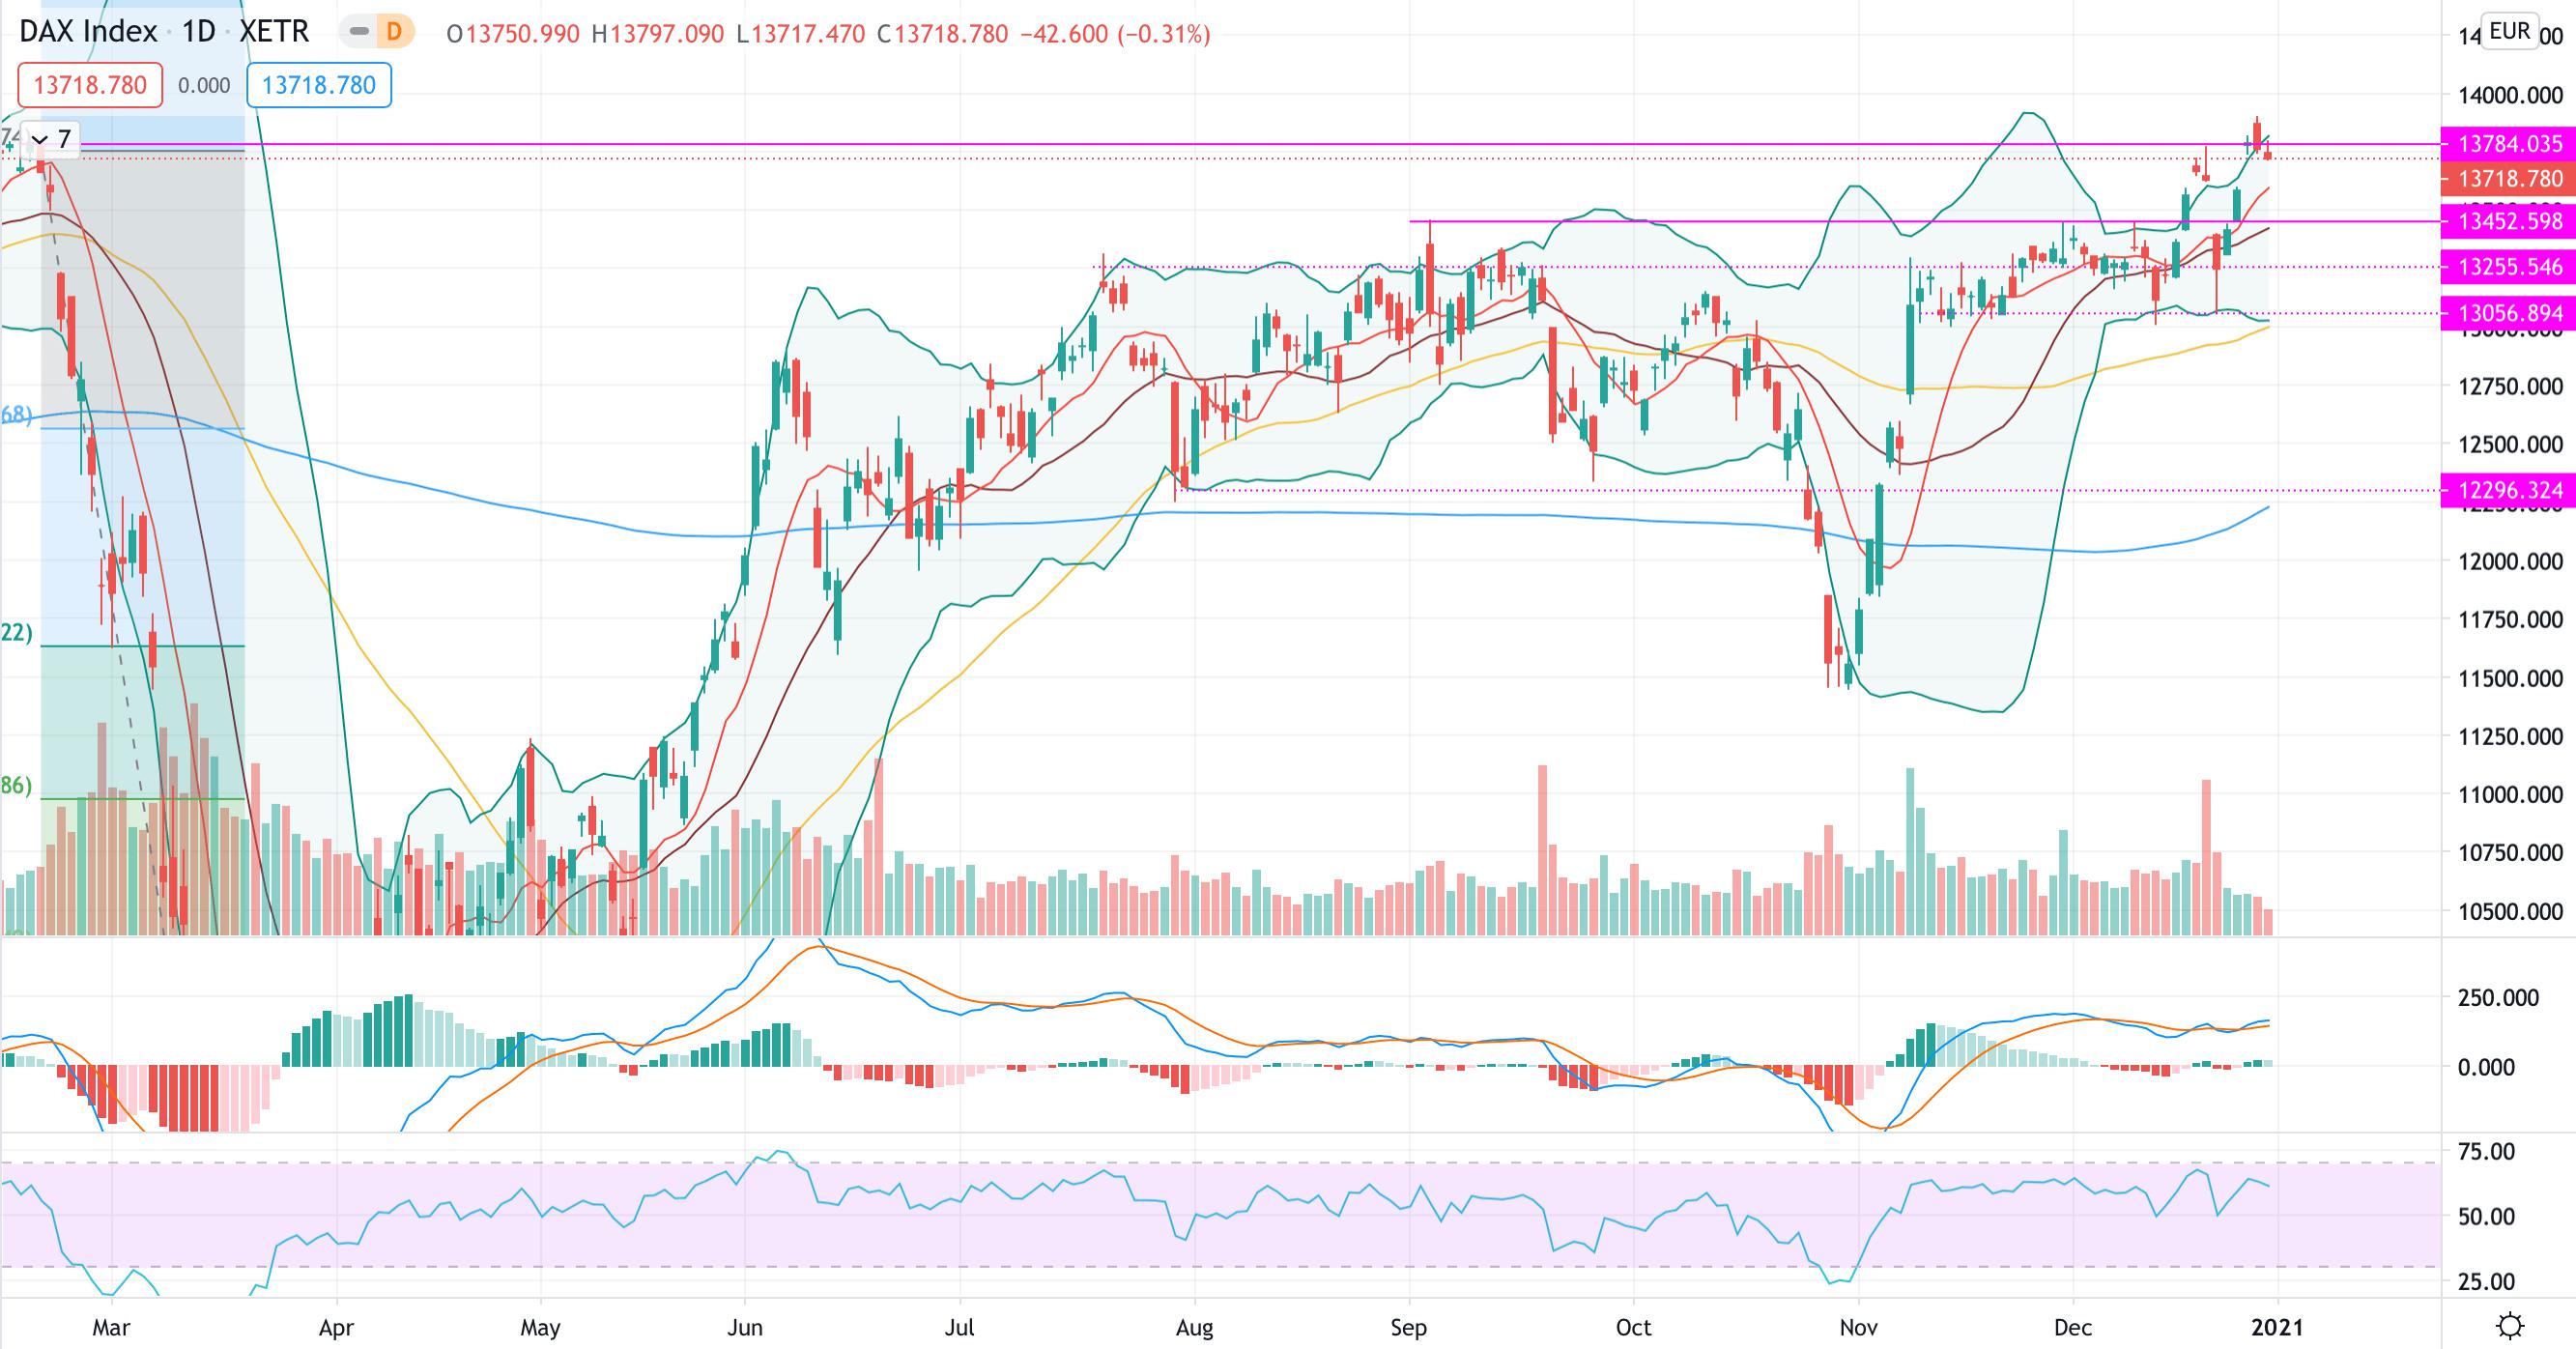
DAX (#DAX)
The DAX, as highlighted last week, kept moving to the upside and it is now floating around the resistance level.
From a technical standpoint, the 9MA aggressively moved to the upside together with the 50MA: this makes the two main resistances at 13,453 and 13,056 strong barriers in case of drastic moves to the downside.
However, by looking at the last two candles reported on the #DAX we might expect slight downwards moves for the coming week: in particular, we might see a retest of 13,600 (9MA) and eventually 13,452 (current resistance).
MACD and RSI are both pointing to the downside, leading us to think that a slight move to the downside is indeed possible, however the overall scenario is still bullish.
At present, we confirm resistance at 13,718 and support 13,452
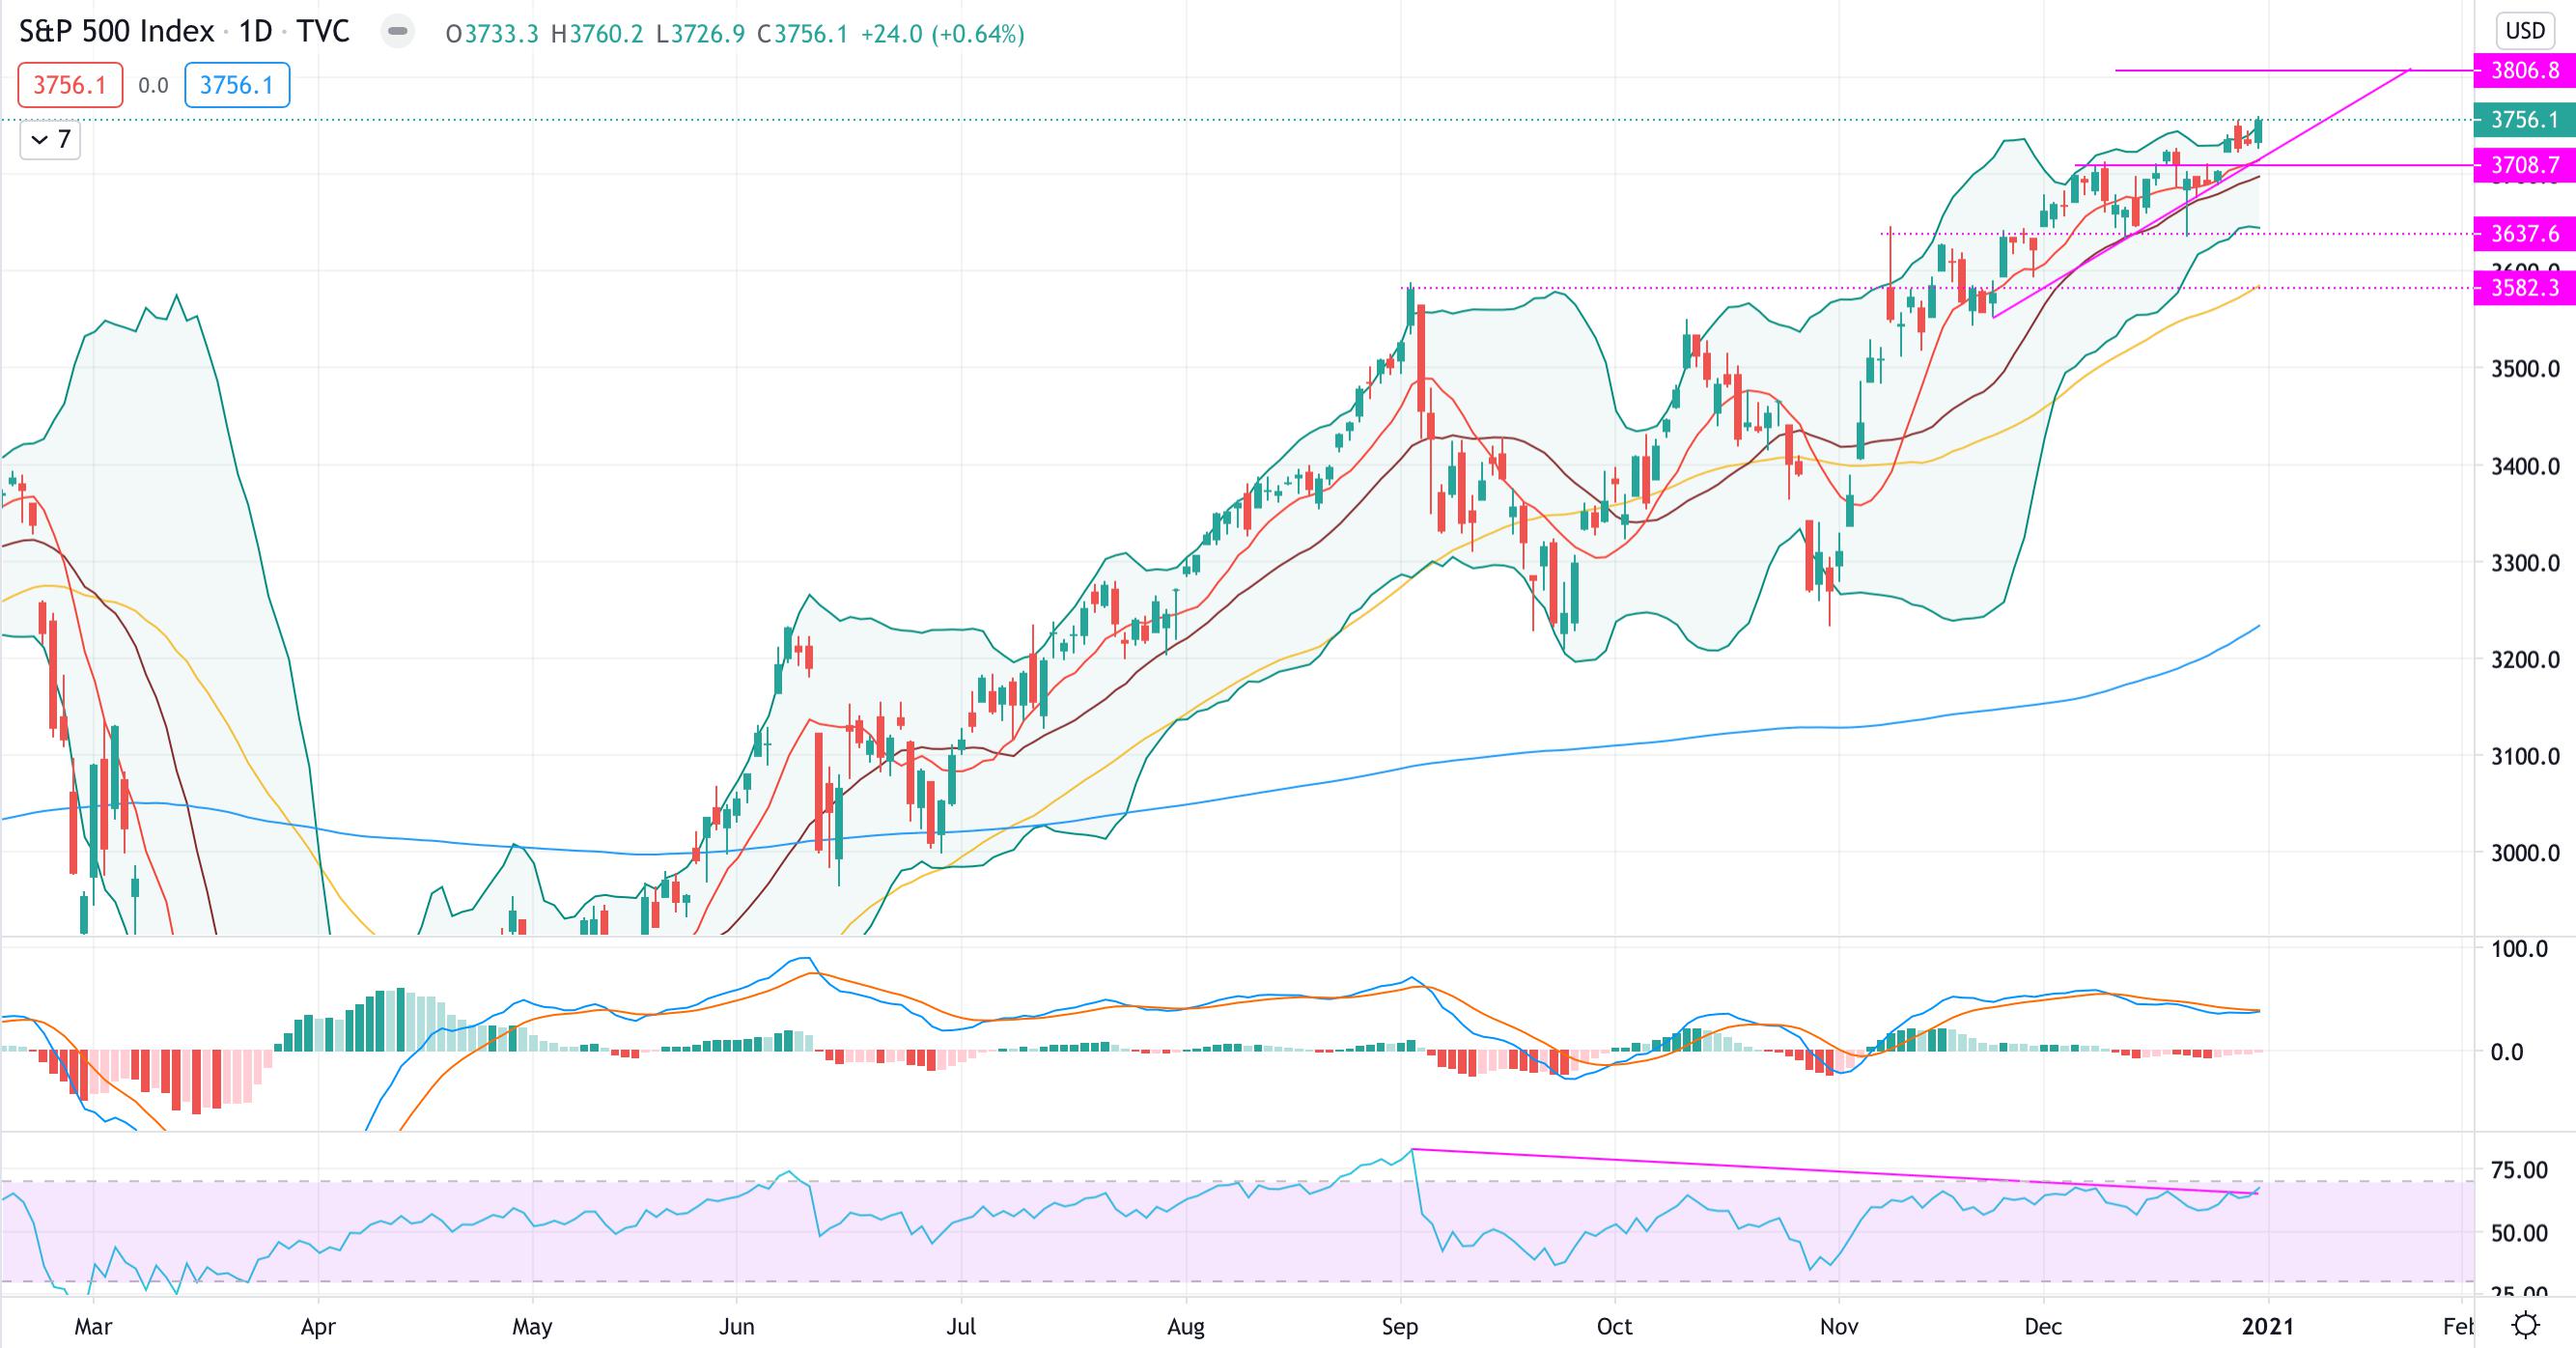
S&P 500 (#SPX)
The #SPX this week was kicked up by promising stimulus check talks: the Index managed to break to the upside the ascending triangle and keeps going at all time market highs.
On Monday, the #SPX broke the resistance level, tested 3,725 (previous market high) and kept going up.
From a technical perspective, we have the MACD that is sloping up giving the sign that possible move to the upside are still possible.
On the contrary, the RSI is reporting a strong divergence with the price: therefore, strong pullbacks are possible.
For the coming week, we expect the #SPX to continue to drift higher: if the upside trend line will be broken, a retest of the support level will be likely.
At present, we see resistance at 3,806 and support at 3,708.
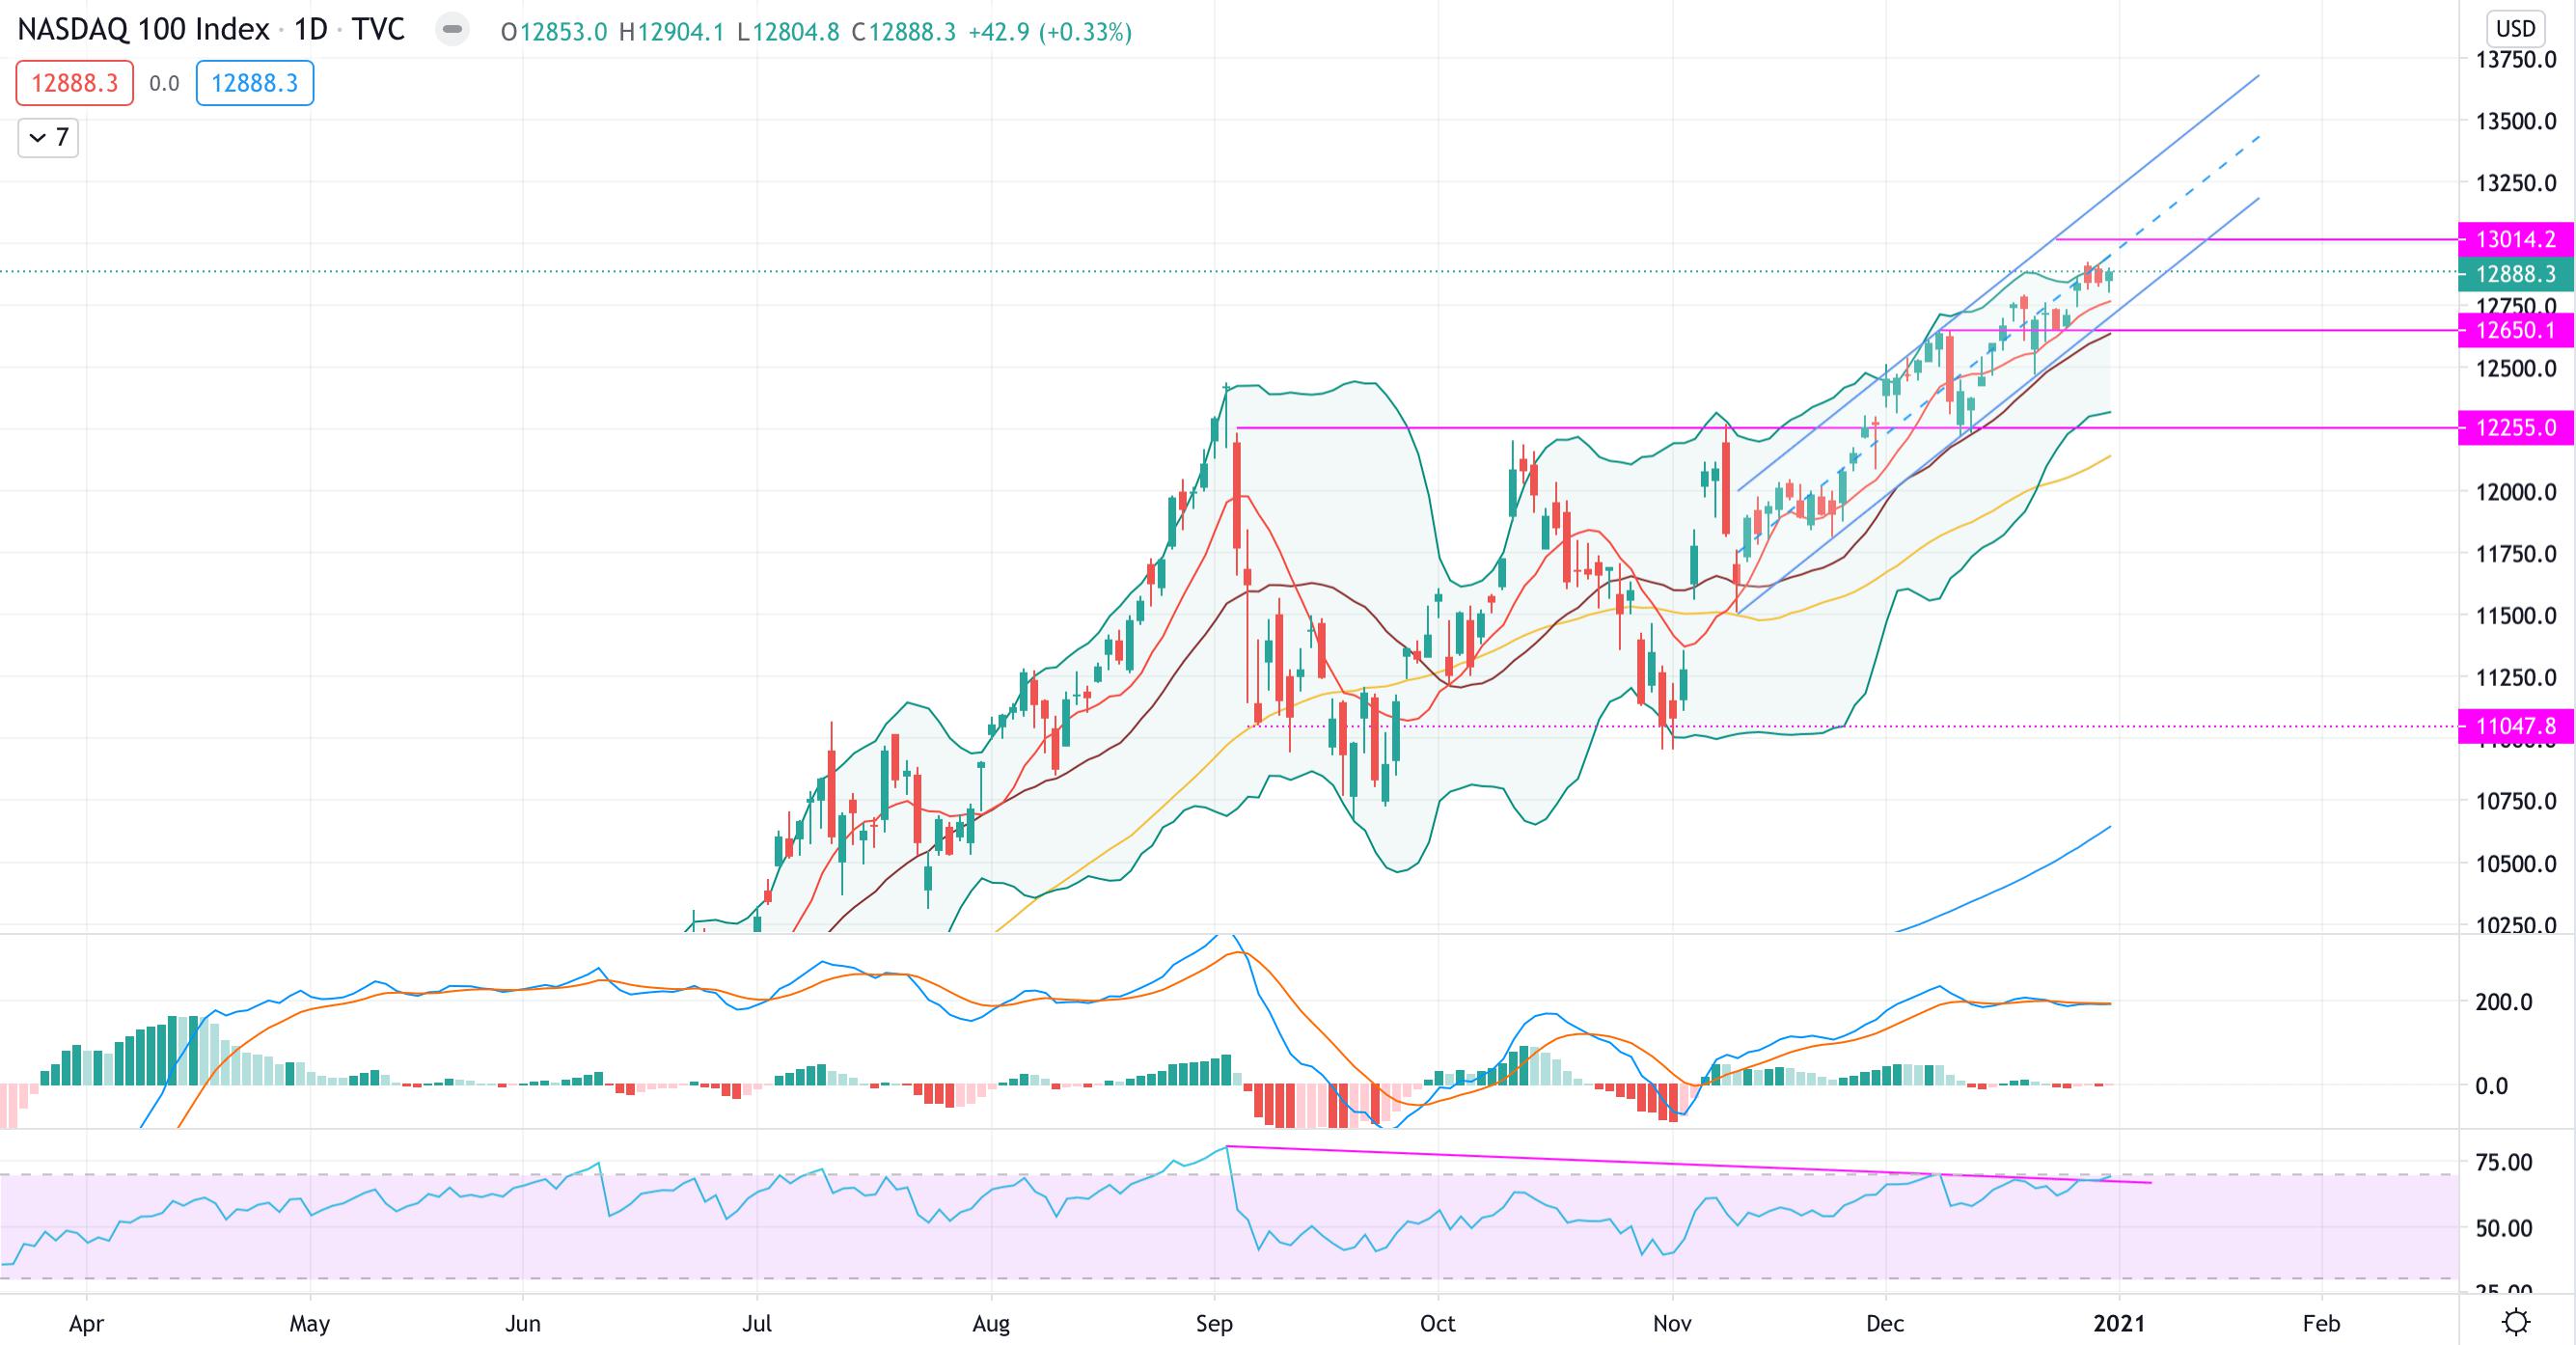
Nasdaq 100 (#NDX)
The Nasdaq 100 managed as well to drift higher, the 9MA hold tight and help the index to reach another all time market high.
The #NDX keep moving on the second half of the upward channel, leading us to think that the Index is loosing its strength more than other US indexes.
From a technical perspective the MACD is moving sideways together with an RSI that is showing a strong divergence with the price: therefore, from one side we have a MACD that is showing indecision, and on the other the RSI giving a strong divergence.The 9MA is holding strong and represents a first resistance level for moves to the downside.
For the coming week, we expect the #NDX to keep moving sideways with perhaps a continuation to the upside at the beginning of the week: in case the channel will be broken we are in favour of a retouch of support area at 12,650, given also the fragile setup we read from the indicators.
At present, we see resistance at 13,014 and support at 12,650.
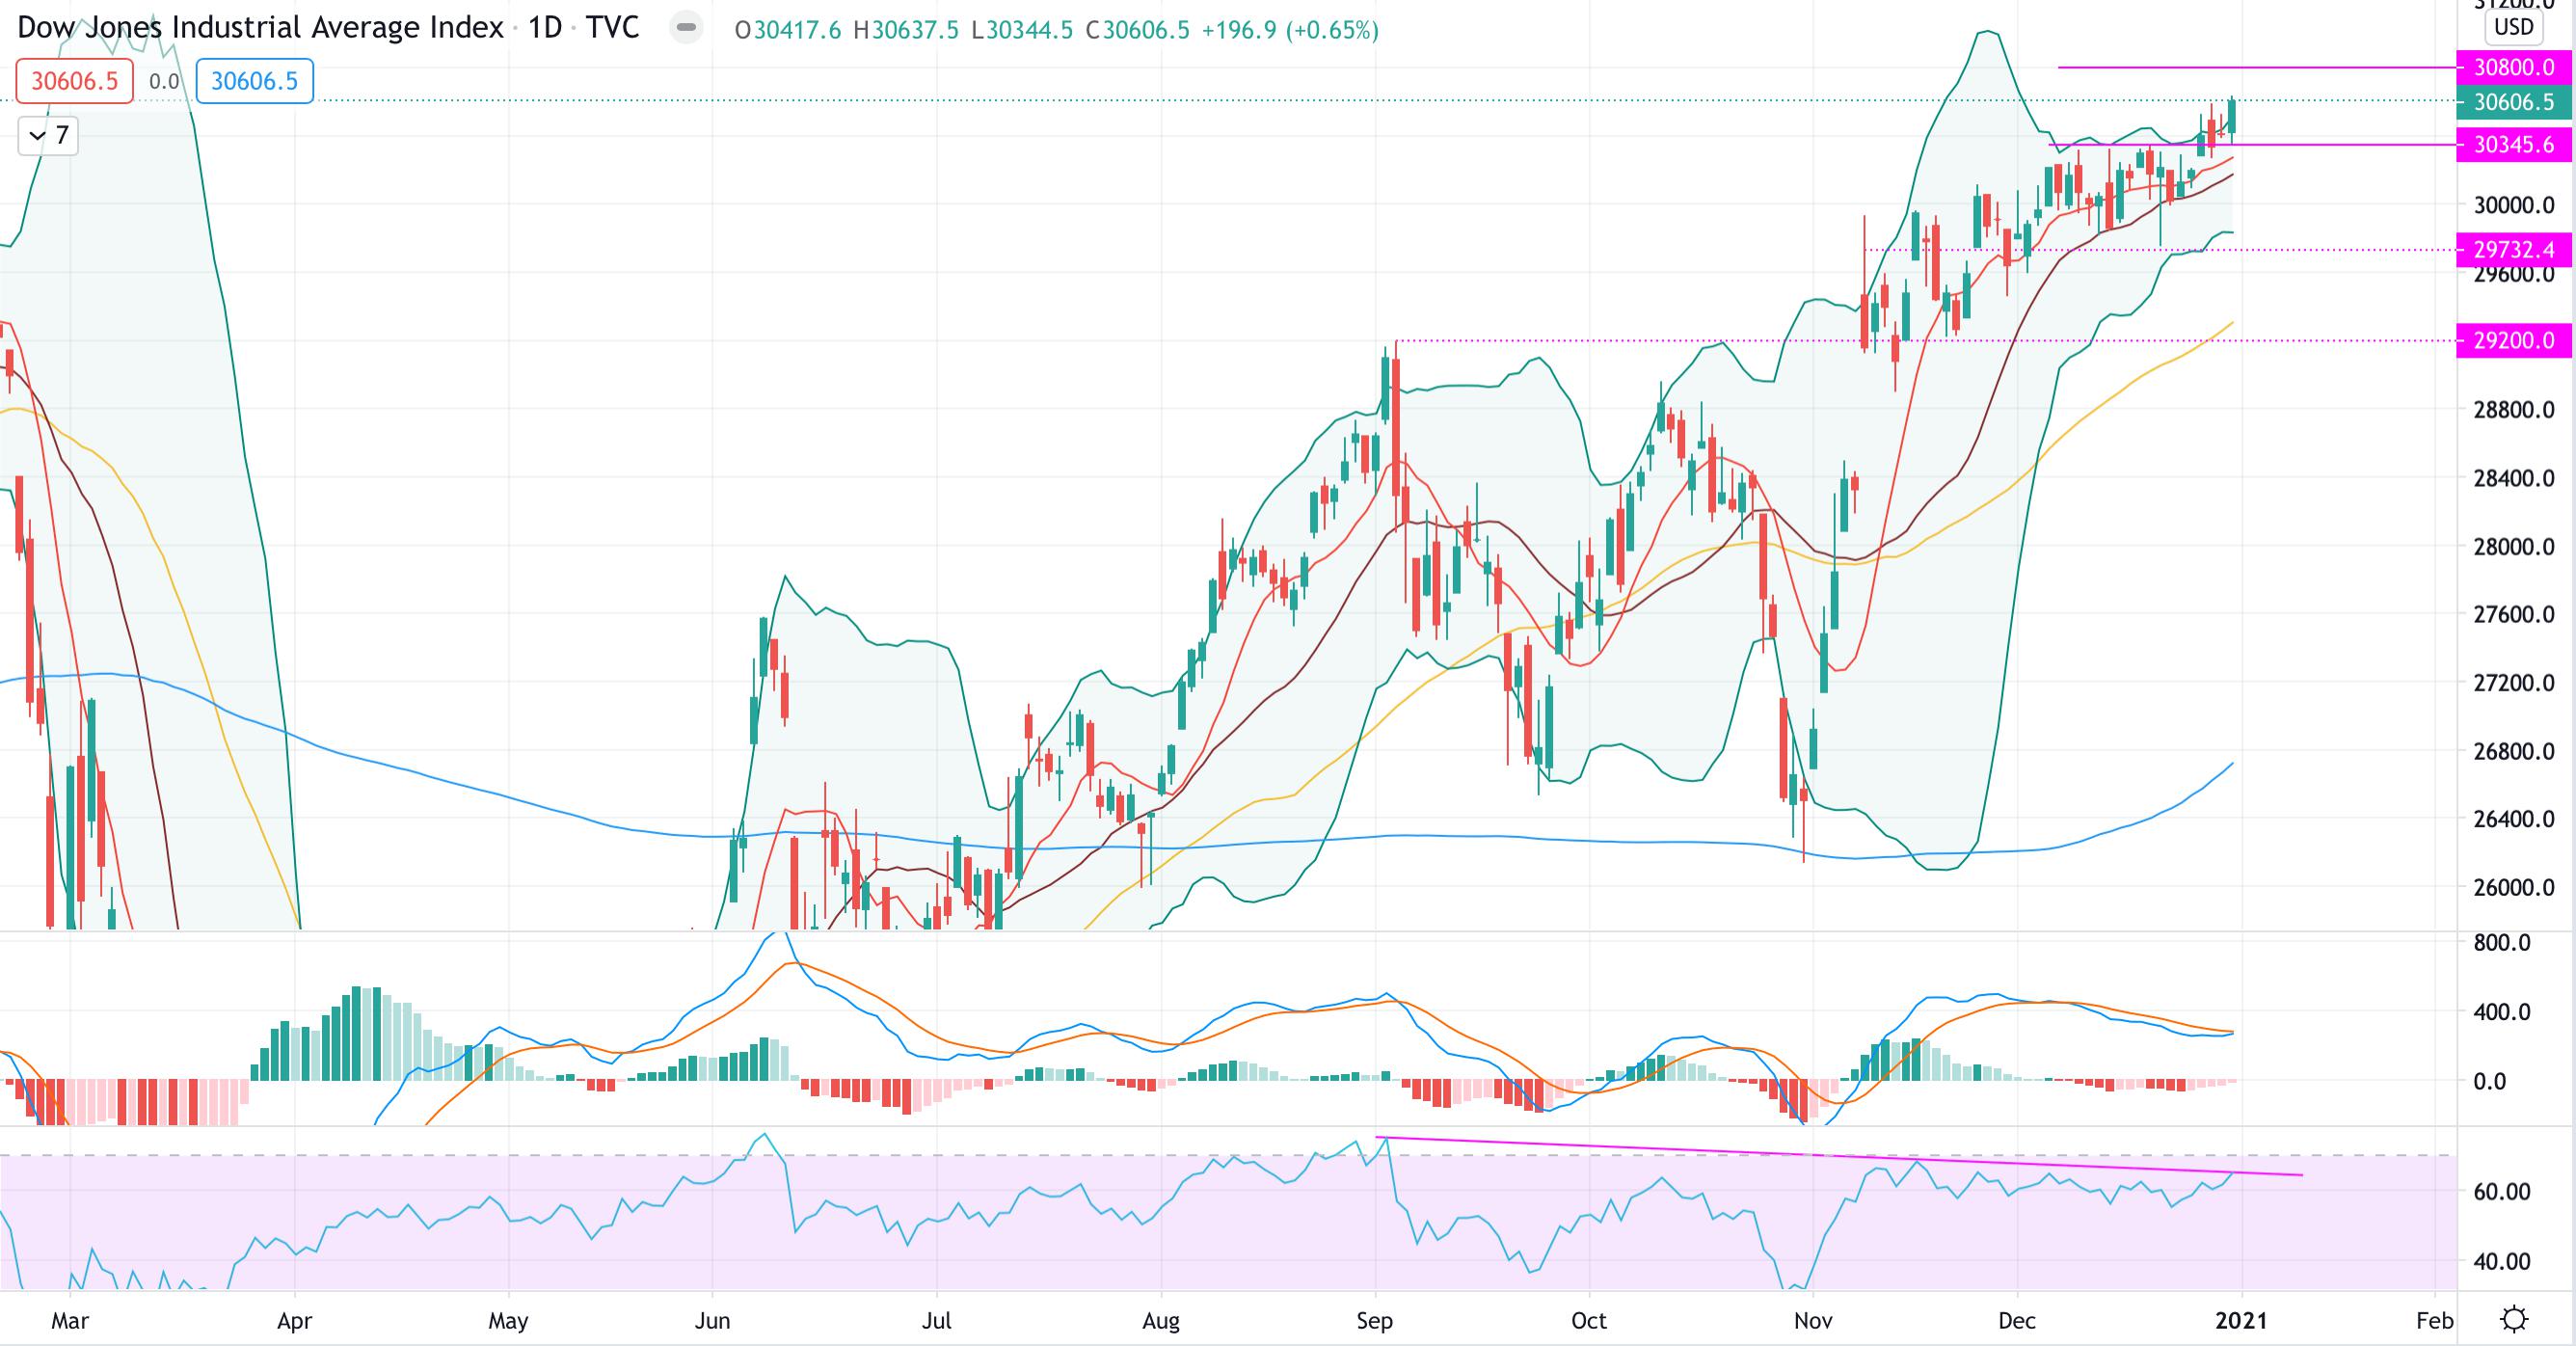
Dow Jones (#DJI)
The Dow Jones had a strong week where it managed to break previous resistance and position itself strongly above it. The price retested the level on Friday and then moved upwards.
From a technical perspective, by looking at the MACD we might expect a continuation to the upside for the coming week: in fact, the MACD, well above 0, is sloping up leading us to think that the bulls are still in control.
At the same time, we invite our readers to proceed with caution: the RSI is reporting a strong diversion with the price. Therefore if the short term is definitely bullish, on a slightly longer timeframe the Index is exhausted and might soon test resistance levels.
A first indicator of upcoming downwards moves might be when the Index will start to close below the 9MA.
For the coming week, we believe the #DJI will continue to the upside given the strong bullish candle on Friday. However, following past weeks patterns, the Index might lose its strength on the second part of the week and move sideways.
At present, we see resistance at 30,800 and support at 30,345.
Reprinted from FXStreet,the copyright all reserved by the original author.
Disclaimer: The content above represents only the views of the author or guest. It does not represent any views or positions of FOLLOWME and does not mean that FOLLOWME agrees with its statement or description, nor does it constitute any investment advice. For all actions taken by visitors based on information provided by the FOLLOWME community, the community does not assume any form of liability unless otherwise expressly promised in writing.
FOLLOWME Trading Community Website: https://www.followme.com


Hot
No comment on record. Start new comment.