Gold Price Analysis: Overbought RSI probes XAU/USD bulls at eight week tops above $1,900

- Gold prices ease from the multi-day high as US dollar marks corrective pullback.
- Risks dwindle amid virus woes, mixed prints of December’s activity numbers in Asia.
- Sustained upside break of short-term triangle favor buyers.
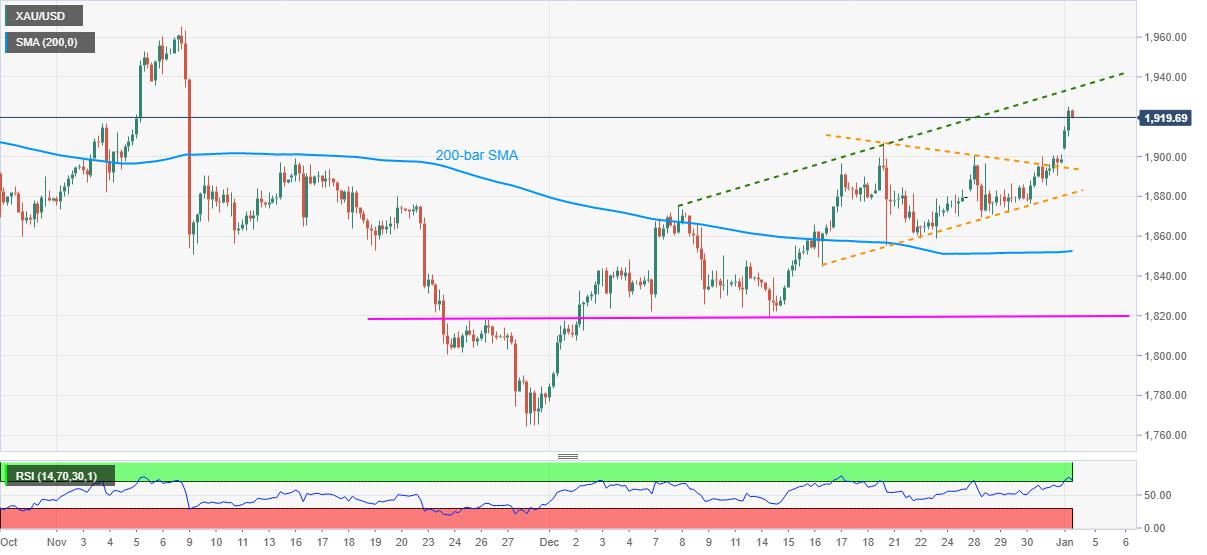
Gold prices trim early Asian gains while receding to $1,921.67, up 1.21% intraday, ahead of Monday’s European session. The yellow metal jumped to its highest since November 09 during early trading hours before stepping back from $1,925.38.
While overbought RSI and the latest pullback in the US dollar index (DXY) could be traced as the triggers for the recent weakness in gold prices, the commodity’s ability to stay beyond a symmetrical triangle from December 16 keeps buyers hopeful.
However, odds of witnessing a pullback to the $1,900 and the resistance line of the stated triangle near $1,893, followed by the triangle support line, at $1,881 now, can’t be ruled out.
In a case where gold sellers conquer a 200-bar SMA level of $1,852.50, short-term horizontal support near $1,820 will be in the spotlight.
Alternatively, an ascending trend line from December 08, at $1,933 now, can offer an intermediate halt during the run-up to November highs near $1,966.
Overall, the risks are changing the course of early-Asian move amid the coronavirus (COVID-19) headlines and ahead of PMI data. However, any strong indicator is yet absent and hence traders may keep their eyes on macro for fresh impulse while cheering the technical breakout.
Gold four-hour chart
Trend: Bullish
Reprinted from FXStreet,the copyright all reserved by the original author.
Disclaimer: The content above represents only the views of the author or guest. It does not represent any views or positions of FOLLOWME and does not mean that FOLLOWME agrees with its statement or description, nor does it constitute any investment advice. For all actions taken by visitors based on information provided by the FOLLOWME community, the community does not assume any form of liability unless otherwise expressly promised in writing.
FOLLOWME Trading Community Website: https://www.followme.com


Hot
No comment on record. Start new comment.