EUR/USD Price Analysis: Bearish RSI divergence on D1

- EUR/USD's daily chart indicator paints a bearish picture.
- The pair may revisit key support before resuming bull run from 1.16.
EUR/USD is currently trading in a sideways manner near 1.2243, having faced rejection above 1.23 in the previous two trading days.
The pair fell by over 0.6% on Thursday, confirming a bearish divergence of the 14-day Relative Strength Index. A bearish divergence occurs when an indicator forms lower highs, contradicting higher highs on the price chart, and often yields deeper pullbacks.
The immediate support is seen at 1.2215 (Thursday's low), which, if breached, would open the doors to 1.2129 (Dec. 21 low). On the higher side, 1.2310 (Wednesday's high) is the level to beat for the bulls.
Daily chart
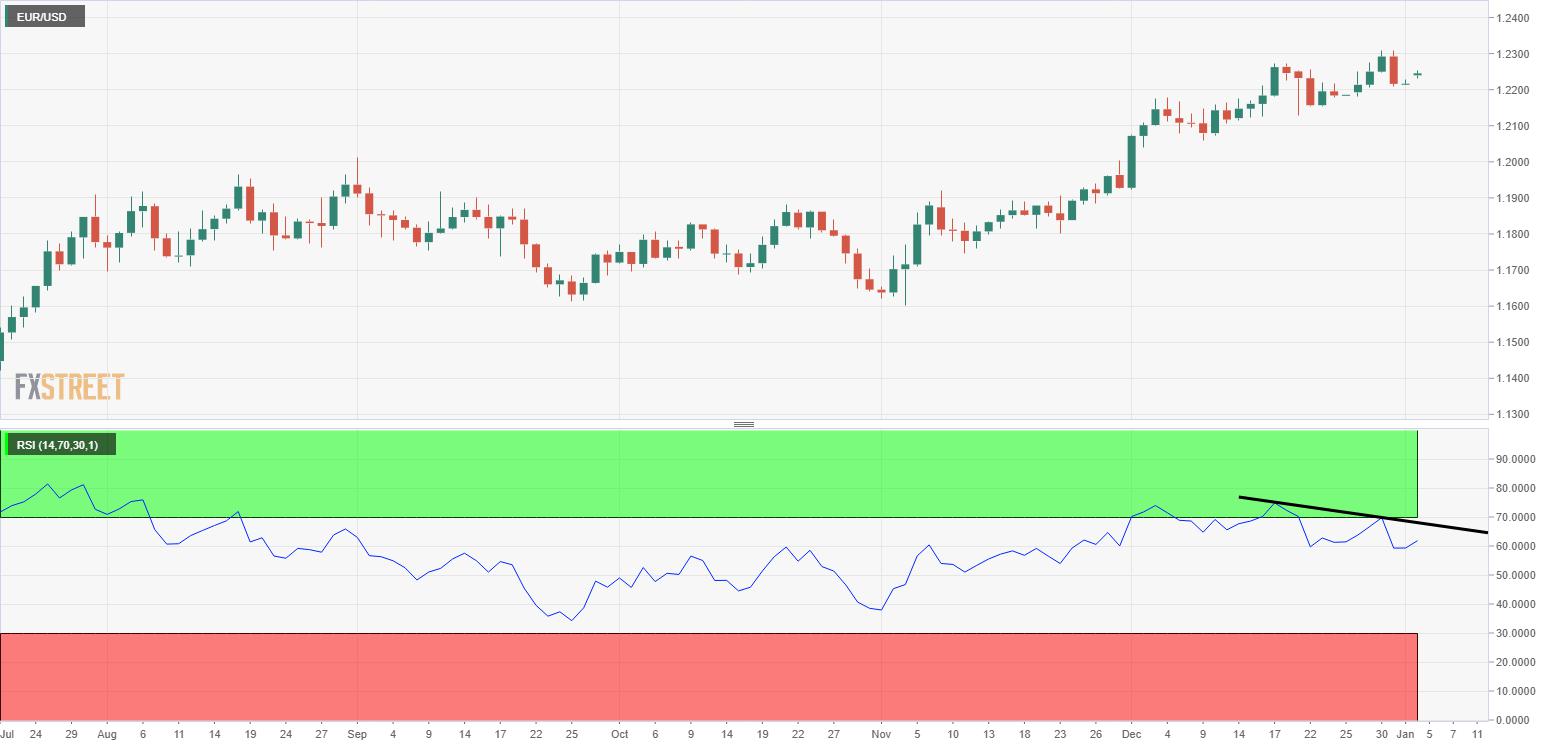
Trend: Pullback likely
Technical levels
Reprinted from FXStreet,the copyright all reserved by the original author.
Disclaimer: The content above represents only the views of the author or guest. It does not represent any views or positions of FOLLOWME and does not mean that FOLLOWME agrees with its statement or description, nor does it constitute any investment advice. For all actions taken by visitors based on information provided by the FOLLOWME community, the community does not assume any form of liability unless otherwise expressly promised in writing.
FOLLOWME Trading Community Website: https://www.followme.com


Hot
No comment on record. Start new comment.