GBP/USD Price Analysis: Cable refreshes multi-month highs

- GBP/USD jumps to the highest level in over 2-1/2 years.
- The weekly chart shows bulls are in control.
GBP/USD is trading at 1.3690 at press time. That's the highest level since April 2018. The previous 31-month high of 1.3686 was reached last week.
The inverse head-and-shoulders breakout seen on the weekly chart indicates the path of least resistance is to the higher side, and significant resistance is currently located at 1.4056. That level is presently housing the trendline falling from 2007 highs.
The broader bias would remain bullish while the pair is held above the previous week's low of 1.3429.
As for today, the former daily chart hurdle-turned-support of 1.3625 is the level to beat for the sellers.
Weekly chart
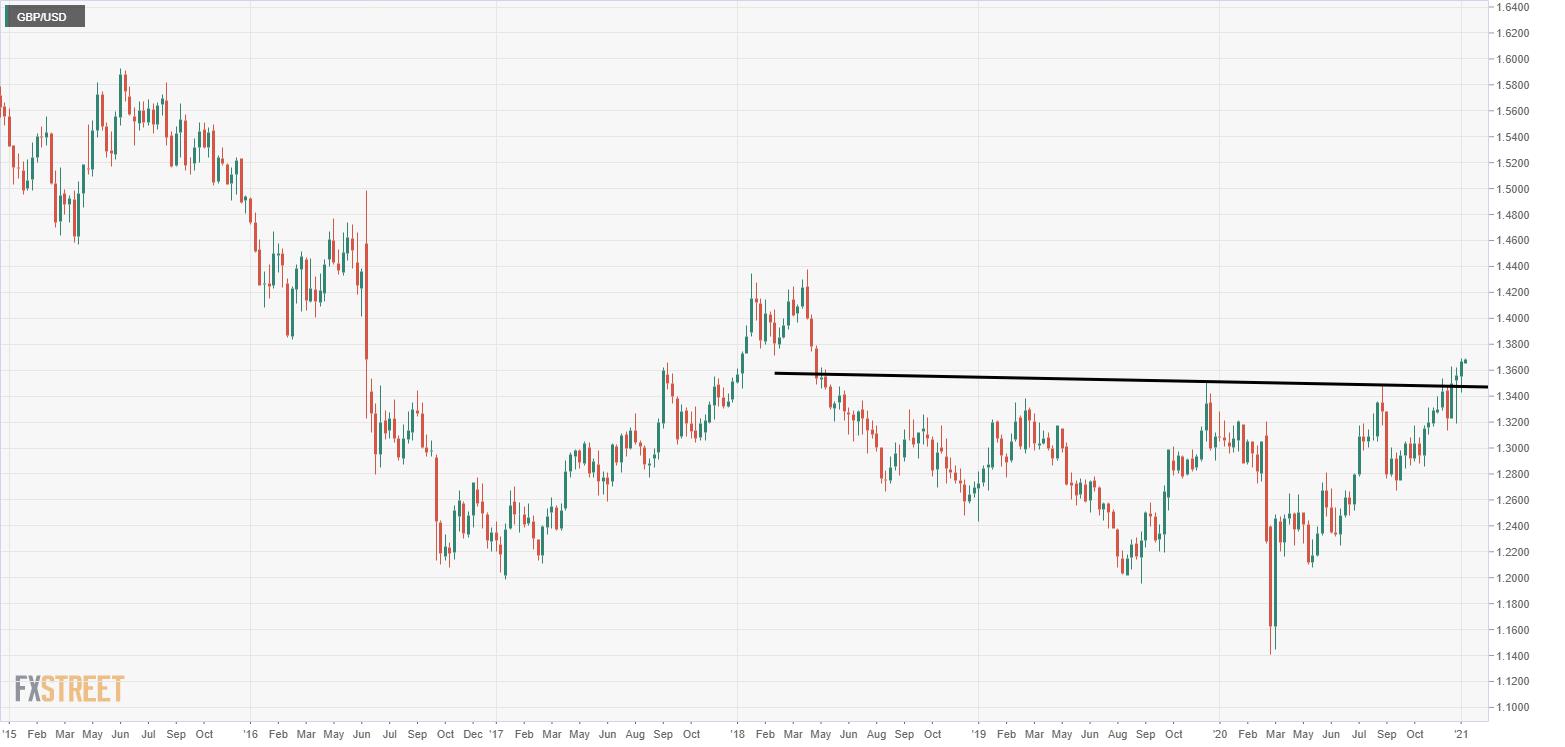
Trend: Bullish
Technical levels
Reprinted from FXStreet,the copyright all reserved by the original author.
Disclaimer: The content above represents only the views of the author or guest. It does not represent any views or positions of FOLLOWME and does not mean that FOLLOWME agrees with its statement or description, nor does it constitute any investment advice. For all actions taken by visitors based on information provided by the FOLLOWME community, the community does not assume any form of liability unless otherwise expressly promised in writing.
FOLLOWME Trading Community Website: https://www.followme.com


Hot
No comment on record. Start new comment.