USD/JPY Price Analysis: Remains vulnerable near two-week lows, around 103.00 mark

- USD/JPY was seen consolidating its losses near two-week lows, around 103.00 mark.
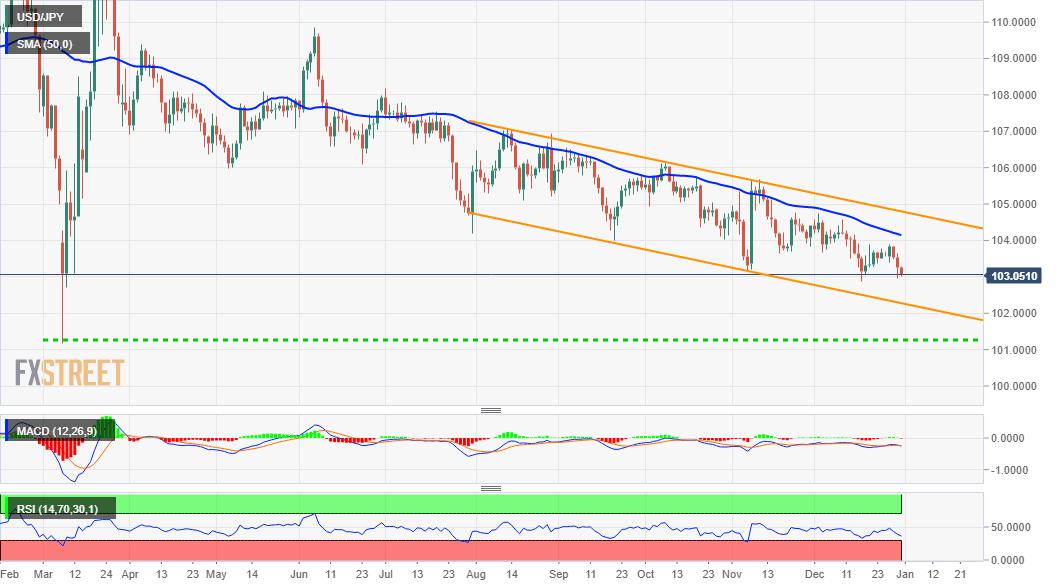
- The formation of a descending channel points to a well-established bearish trajectory.
- The pair seems vulnerable to challenge the channel support, near the 102.60-55 area.
The USD/JPY pair now seems to have entered a bearish consolidation phase and was seen oscillating in a range around 103.00 mark, just above two-week lows set on Wednesday.
Looking at the technical picture, the pair has been trending lower over the past four months or so along a downward sloping channel. This, in turn, points to a well-established downtrend and supports prospects for further weakness.
The negative outlook is reinforced by the fact that technical indicators on the daily chart have been struggling to recover from the bearish trajectory. However, year-end thin trading volumes held bearish traders from placing fresh bets.
Nevertheless, the USD/JPY pair remains vulnerable to slide further below December monthly swing lows and aim to challenge the lower boundary of the trend channel. The mentioned support is currently pegged near the 102.60-55 region.
Some follow-through selling will mark a fresh bearish breakdown and set the stage for an extension of the depreciating move. The USD/JPY pair might then accelerate the slide to the 102.00 mark before eventually dropping to test 2020 lows, around the 101.20-15 region.
On the flip side, the 103.40-50 area now becomes immediate strong resistance ahead of weekly highs, just ahead of the 104.00 level. A sustained move beyond might trigger a short-covering bounce and push the USD/JPY pair to the 104.70-75 supply zone.
This is followed by the key 105.00 psychological mark, which coincides with the trend-channel resistance and act as a strong barrier for the USD/JPY pair.
USD/JPY daily chart
Technical levels to watch
Reprinted from FXStreet,the copyright all reserved by the original author.
Disclaimer: The content above represents only the views of the author or guest. It does not represent any views or positions of FOLLOWME and does not mean that FOLLOWME agrees with its statement or description, nor does it constitute any investment advice. For all actions taken by visitors based on information provided by the FOLLOWME community, the community does not assume any form of liability unless otherwise expressly promised in writing.
FOLLOWME Trading Community Website: https://www.followme.com


Hot
No comment on record. Start new comment.