USD/CAD Price Analysis: Bears’ shouldn’t ignore falling wedge on 1D

- USD/CAD stays depressed for the fourth consecutive day.
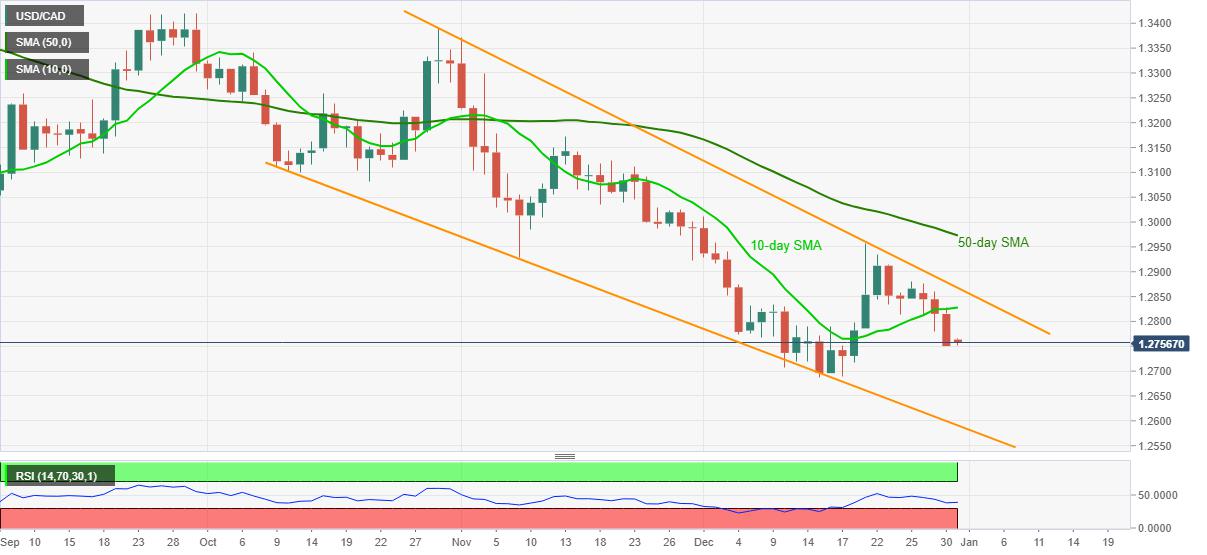
- Sustained downside break of 10-day SMA favors bears targeting fresh low since April 2018.
- 50-day SMA adds to the upside filters beyond the bullish chart pattern.
USD/CAD wavers around the mid-1.2700s while keeping the recent downside momentum during Thursday’s Asian session. The pair dropped below 10-day SMA for the first time in two weeks the previous day.
Although sustained trading below key SMAs and an absence of extreme RSI conditions suggest a continuation of the present downtrend, sellers have limited scope below the April 2018 lows inside the bullish formation.
That said, two bounces off 1.2688, the multi-month low flashed before two weeks, are on the USD/CAD sellers’ radar at the moment. Though, any further downside will be challenged by the lower line of the stated pattern near 1.2590.
Meanwhile, an upside clearance of 10-day SMA, at 1.2827 now, will eye to confirm the stated bullish pattern with a break above the 1.2870 resistance line.
Although a successful move past-1.2870 theoretically indicates a gradual run-up beyond 1.3500, 50-day SMA near 1.2970, the 1.3000 theshold and multiple tops below 1.3400 can challenge the bulls during the rise.
USD/CAD daily chart
Trend: Pullback expected
Reprinted from FXStreet,the copyright all reserved by the original author.
Disclaimer: The content above represents only the views of the author or guest. It does not represent any views or positions of FOLLOWME and does not mean that FOLLOWME agrees with its statement or description, nor does it constitute any investment advice. For all actions taken by visitors based on information provided by the FOLLOWME community, the community does not assume any form of liability unless otherwise expressly promised in writing.
FOLLOWME Trading Community Website: https://www.followme.com


Hot
No comment on record. Start new comment.