Gold Price Futures (GC) Technical Analysis – $1870.30 to $1894.60 Controlling Near-Term Direction

Gold futures are trading higher at the mid-session on Wednesday, as hopes for increased fiscal stimulus pushed the U.S. Dollar to its lowest level in more than 2-1/2 years. Gains were limited, however, by global COVID-19 vaccine rollouts and increased risk appetite.
The dollar index tumbled to a low not seen since April 2018 following U.S. Senate Majority Leader Mitch McConnell’s decision to delay a vote on increasing COVID-19 relief checks to $2,000.
At 17:15 GMT, February Comex gold is trading $1889.10, up $6.20 or +0.33%.
According to CNBC, efforts to boost the direct payments in the year-end coronavirus relief bill to $2,000 stalled on Wednesday as Senate Republican leaders and Democrats appeared divided over whether to send more relief.
Daily Swing Chart Technical Analysis
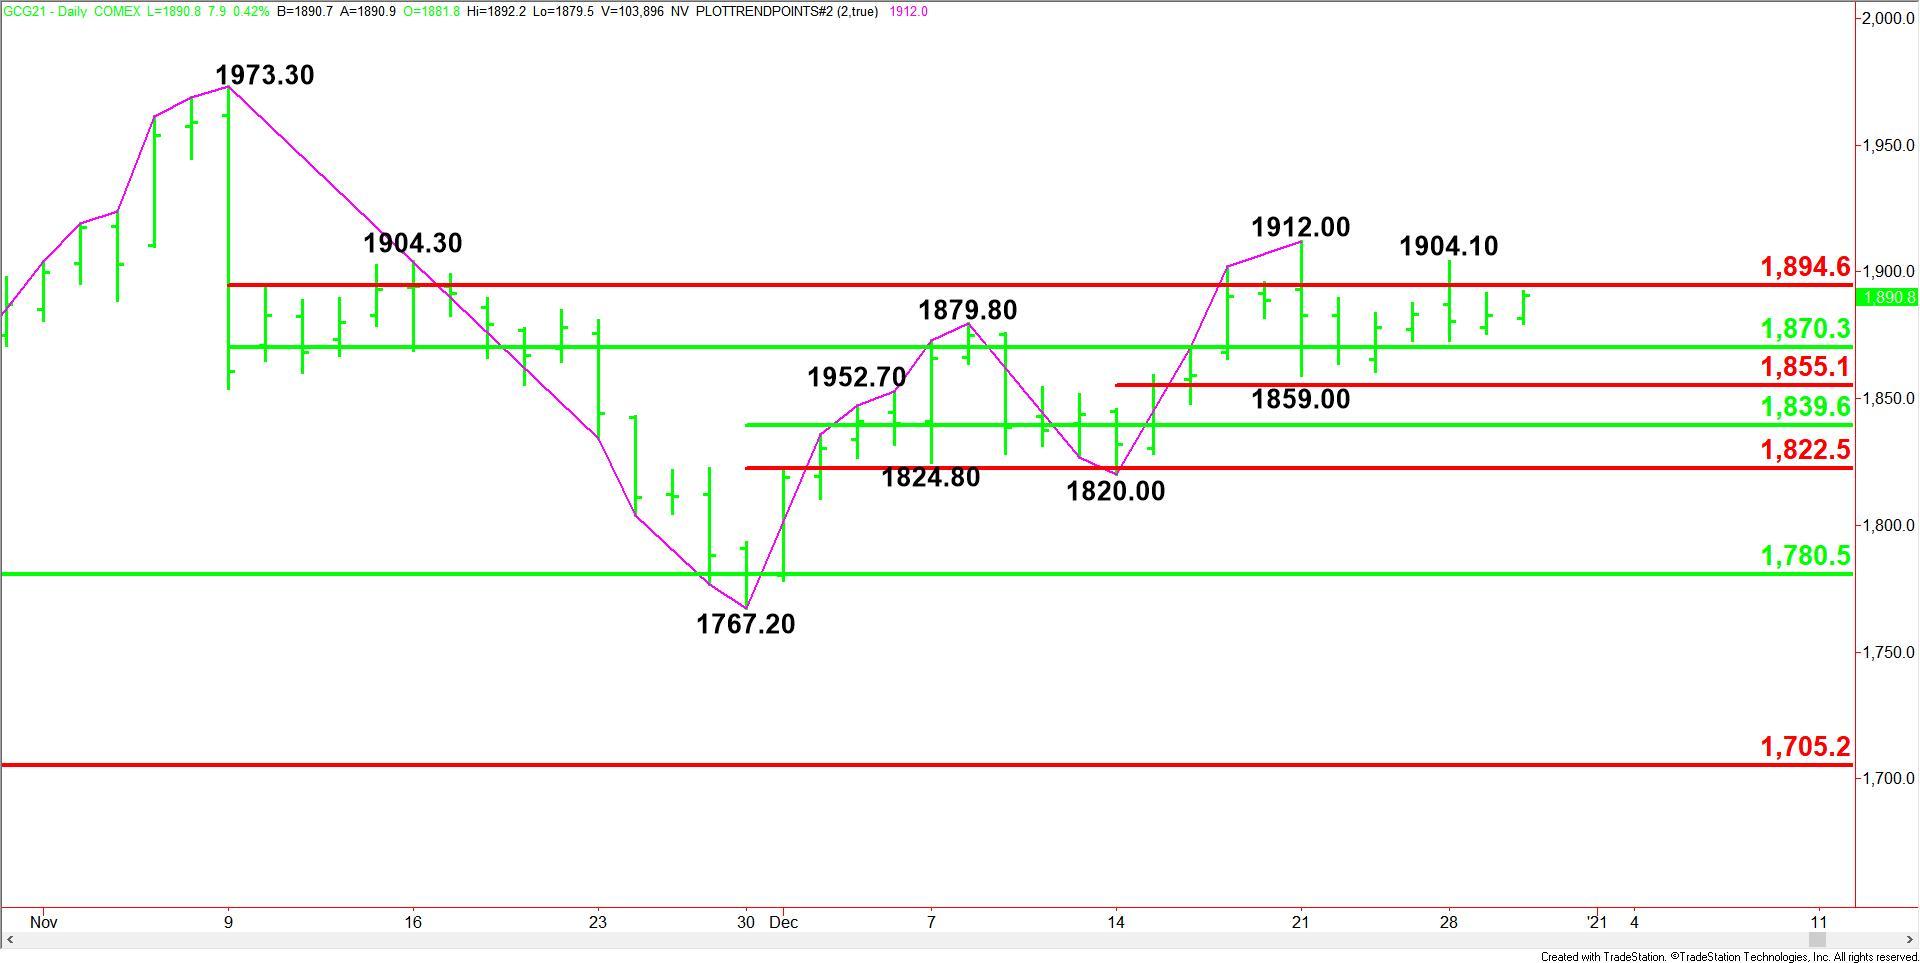
The main trend is up according to the daily swing chart, however, the market has been in a holding pattern for six sessions. A trade through $1912.00 will signal a resumption of the uptrend. The main trend will change to down on a move through $1820.00.
The main range is $1973.30 to $1767.20. Its retracement zone at $1870.30 to $1894.60 is currently being tested. This zone is controlling the near-term direction of the market.
The minor range is $1820.00 to $1912.00. Its retracement zone at $1866.00 to $1855.10 is additional support.
The short-term range is $1767.20 to $1912.00. Its retracement zone at $1839.60 to $1822.50 is the last potential support zone before the major retracement zone at $1780.50 to $1705.20. This zone stopped the selling at $1767.20 on November 30.
Daily Swing Chart Technical Forecast
The early price action suggests the direction of the February Comex gold market into the close will be determined by trader reaction to $1870.30 and $1894.60.
Bullish Scenario
An upside bias could develop late in the session on a sustained move over $1894.60. If this move is able to generate some upside momentum late in the session then look for the rally to possibly extend into a pair of minor tops at $1904.10 and $1912.00. However, we don’t expect to see a bona fide breakout to the upside due to the low volume.
Bearish Scenario
A sustained move under the 50% level at $1870.30 will be a sign of weakness. This is likely to trigger a labored break due to a series of retracement levels at $1866.00, $1855.10, $1839.60 and $1822.50.
For a look at all of today’s economic events, check out our economic calendar.
Reprinted from Fxempire_ForecastsSpider,the copyright all reserved by the original author.
Disclaimer: The content above represents only the views of the author or guest. It does not represent any views or positions of FOLLOWME and does not mean that FOLLOWME agrees with its statement or description, nor does it constitute any investment advice. For all actions taken by visitors based on information provided by the FOLLOWME community, the community does not assume any form of liability unless otherwise expressly promised in writing.
FOLLOWME Trading Community Website: https://www.followme.com


Hot
No comment on record. Start new comment.