USD/CAD Price Analysis: Struggles to hold 1.2800 below key HMAs, weekly resistance line

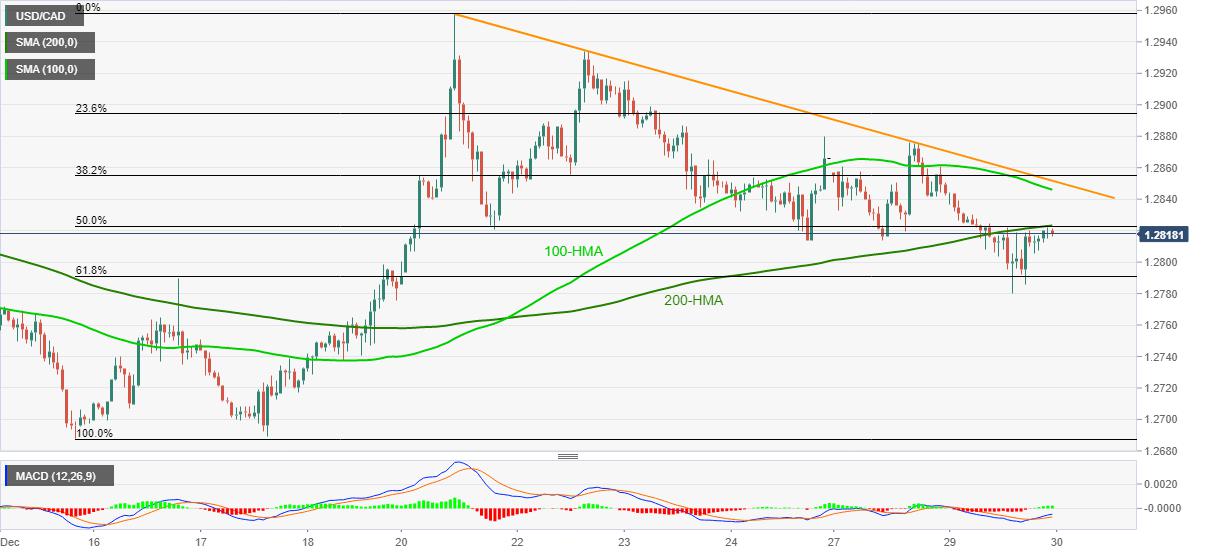
- USD/CAD fades bounce off 1.2780 as 200-HMA, 50% of Fibonacci retracement offers immediate resistance.
- 100-HMA, falling trend line from December 21 adds to the upside filters amid sluggish MACD.
USD/CAD steps back from 200-HMA to 1.2817 during Wednesday’s Asian session. In doing so, the loonie pair fails to extend corrective pullback from 61.8% Fibonacci retracement of December 15-21 upside.
Not only 200-HMA and a 50% Fibonacci retracement confluence that restricts the quote’s immediate upside around 1.2825 but 100-HMA and a short-term descending trend line also challenge the USD/CAD buyers. Further probe the upside momentum is receding strength of the bullish MACD.
That said, USD/CAD sellers eye revisit of 61.8% Fibonacci retracement, at 1.2791, during the fresh downside. However, the 1.2800 round-figure may offer an intermediate halt.
In a case where the bears dominate past-1.2790, the monthly low around 1.2688 can return to the charts.
Alternatively, an upside clearance of 1.2825 immediate resistance confluence will aim for the 100-HMA level of 1.2846 before confronting a seven-day-old trend line resistance near 1.2852.
It should, however, be noted that the USD/CAD run-up beyond 1.2852 enables it to probe the monthly top, currently around 1.3010.
USD/CAD hourly chart
Trend: Further weakness expected
Reprinted from FXStreet,the copyright all reserved by the original author.
Disclaimer: The content above represents only the views of the author or guest. It does not represent any views or positions of FOLLOWME and does not mean that FOLLOWME agrees with its statement or description, nor does it constitute any investment advice. For all actions taken by visitors based on information provided by the FOLLOWME community, the community does not assume any form of liability unless otherwise expressly promised in writing.
FOLLOWME Trading Community Website: https://www.followme.com


Hot
No comment on record. Start new comment.