Gold Price Analysis: XAU/USD seems poised to climb back to $1900 mark

- Gold attracted some dip-buying near two-week-old ascending trend-line amid weaker USD.
- Bullish technical set-up supports prospects for a move back towards the $1900 round-figure.
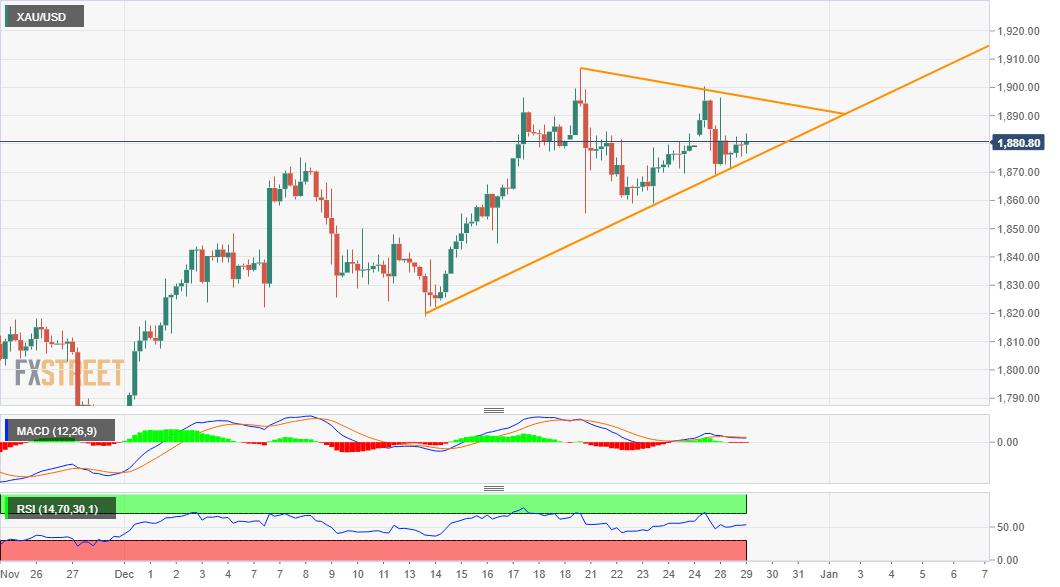
Gold stalled overnight rejection slide from the $1900 mark and managed to attract some buying near a support marked by two-week-old ascending trend-line. The uptick was exclusively sponsored by renewed US dollar selling, which tends to benefit dollar-denominated commodity.
Meanwhile, technical indicators on the daily chart maintained their bullish bias and have again started gaining positive traction on hourly charts. The set-up supports prospects for additional gains, though the prevalent risk-on environment might cap the upside.
That said, the XAU/USD still seems poised to build on the intraday positive move and aim to test another descending trend-line resistance. The mentioned resistance constitutes the formation of a symmetrical triangle and is currently pegged near the $1895 region.
A sustained move beyond will be seen as a fresh trigger for bullish traders and assist the yellow metal to move back above the $1900 mark. Some follow-through buying beyond monthly swing highs, around the $1906-07 area, will set the stage for an extension of the positive move.
On the flip side, the triangle support, currently near the $1875 region, might continue to protect the immediate downside. Failure to defend the mentioned support might turn the commodity vulnerable to slide back to test last week's swing lows, around the $1957-55 region.
XAU/USD 4-hourly chart
Technical levels to watch
Reprinted from FXStreet,the copyright all reserved by the original author.
Disclaimer: The content above represents only the views of the author or guest. It does not represent any views or positions of FOLLOWME and does not mean that FOLLOWME agrees with its statement or description, nor does it constitute any investment advice. For all actions taken by visitors based on information provided by the FOLLOWME community, the community does not assume any form of liability unless otherwise expressly promised in writing.
FOLLOWME Trading Community Website: https://www.followme.com


Hot
No comment on record. Start new comment.