US Dollar Index Price Analysis: DXY drops to the lowest since April 2018

- DXY stays depressed after beginning the week with a downside gap to fresh multi-month low.
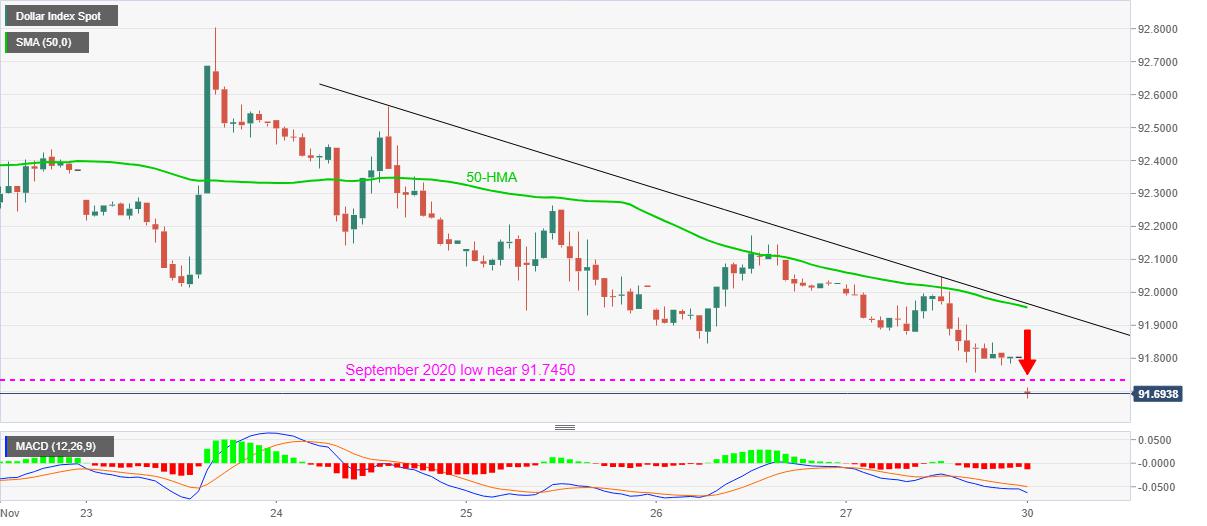
- Bearish MACD, sustained trading below short-term resistance line, HMA favor sellers.
- The 92.00 round-figure can offer an immediate upside barrier.
US dollar index (DXY) remains on the back foot around 91.69, the lowest levels since April 30, 2018, during the early Monday. The greenback gauge began the week with the downside gap below the yearly bottom, marked in September.
With the MACD flashing bearish signals and a confluence of 50-HMA and one-week-old falling trend line restricting the DXY’s immediate upside, it becomes safe to say that the greenback bears have the controls.
The same can keep the US dollar sellers directed towards the March 2018 high near 90.95 while April 27, 2018 bottom close to 91.50 and the lows marked in September 2017 close to 91.00, offer intermediate halts during the south-run.
On the contrary, September 2020 low near 91.7450 offers immediate resistance ahead of the joint of 50-HMA and a short-term resistance line near 91.95.
However, buyers are less likely to consider taking risks of buying unless the quote crosses the 92.00 threshold.
DXY hourly chart
Trend: Bearish
Reprinted from FXStreet,the copyright all reserved by the original author.
Disclaimer: The content above represents only the views of the author or guest. It does not represent any views or positions of FOLLOWME and does not mean that FOLLOWME agrees with its statement or description, nor does it constitute any investment advice. For all actions taken by visitors based on information provided by the FOLLOWME community, the community does not assume any form of liability unless otherwise expressly promised in writing.
FOLLOWME Trading Community Website: https://www.followme.com


Hot
No comment on record. Start new comment.