GBP/USD Price Analysis: Monthly support line backs the bulls above 1.3300

- GBP/USD bounces off two-week-old horizontal line to refresh intraday high.
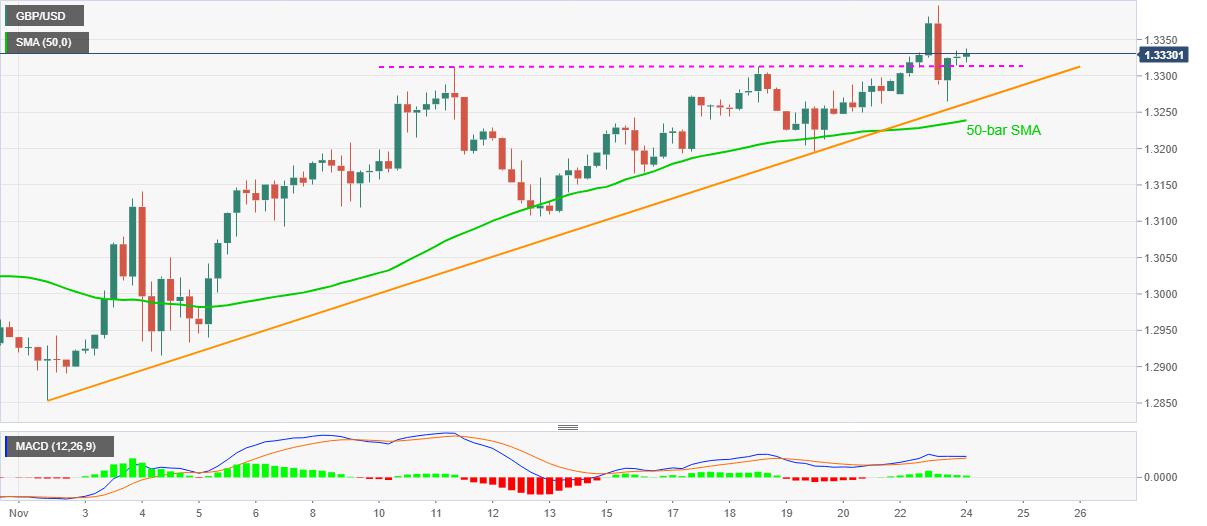
- Bullish MACD, sustained strength above 50-bar SMA favor buyers.
GBP/USD prints mild gains while rising to 1.3330, an intraday high of 1.3338, during early Tuesday. The Cable surged to the fresh high since early September the previous day before stepping back from 1.3397.
However, the following U-turn from a horizontal line connecting highs marked since November 11 joins bullish MACD to favor the pair buyers. Also supporting the odds of GBP/USD upside is the successful trading past-50-bar SMA.
As a result, the 1.3400 round-figure acts as an immediate upside hurdle for the GBP/USD buyers ahead of the yearly peak surrounding 1.3485.
In a case where the quote remains positive beyond 1.3485, the late-2019 top near 1.3515 could return to the charts.
Meanwhile, a downside break of 1.3310 immediate horizontal support will battle the ascending trend line from November 02, at 1.3262 now, before retesting the 50-bar SMA level of 1.3238. However, any more weakness below 1.3238 will direct GBP/USD sellers toward the November 12 low near the 1.3100 round-figure.
GBP/USD four-hour chart
Trend: Bullish
Reprinted from FXStreet,the copyright all reserved by the original author.
Disclaimer: The content above represents only the views of the author or guest. It does not represent any views or positions of FOLLOWME and does not mean that FOLLOWME agrees with its statement or description, nor does it constitute any investment advice. For all actions taken by visitors based on information provided by the FOLLOWME community, the community does not assume any form of liability unless otherwise expressly promised in writing.
FOLLOWME Trading Community Website: https://www.followme.com


Hot
No comment on record. Start new comment.