USD/TRY Price Analysis: Keeps bounce off 100-day SMA above 7.6500

- USD/TRY extends recovery from two-month low while piercing 50% Fibonacci retracement off-late.
- One-week-old falling trend line lures buyers ahead of 50-day SMA.
- Bearish MACD, immediate resistances question the bullish momentum.
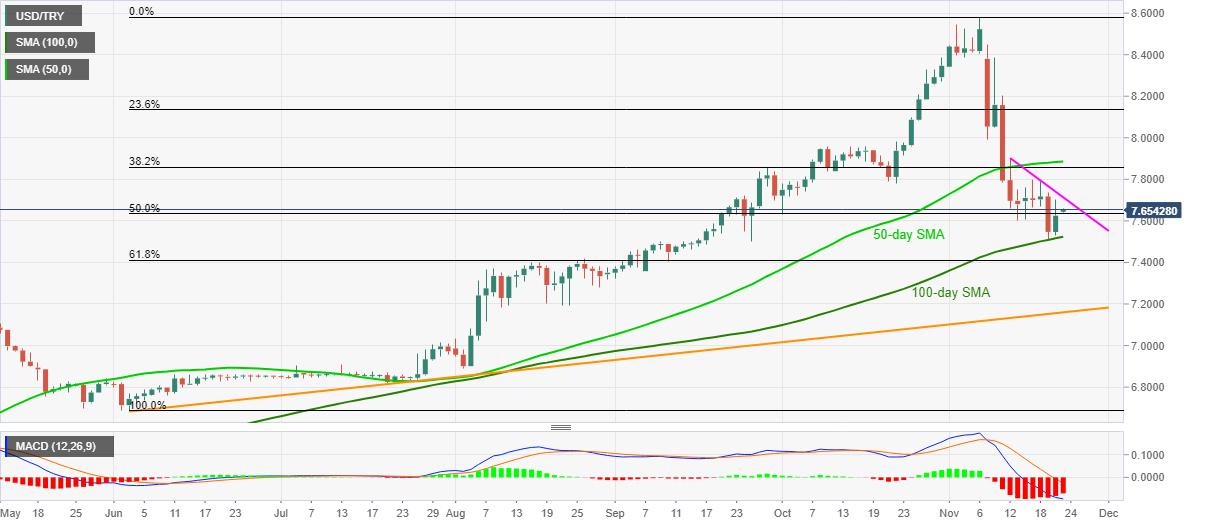
USD/TRY flirts with the intraday high of 7.6584, currently up 0.39% around 7.6542, during Monday’s Asian session. In doing so, the pair crosses 50% Fibonacci retracement of June-November upside while stretching Thursday’s bounce off 100-day SMA.
Strong SMA support joins the recent upside break of the key Fibonacci retracement to direct USD/TRY buyers towards a descending trend line from November 12, at 7.7135 now. However, bearish MACD signals challenge the pair’s further upside.
Not only the short-term resistance line but 50-day SMA near 7.8860 also challenge the USD/TRY bulls.
Alternatively, a downside break of 50% Fibonacci retracement level of 7.6338 can re-direct the USD/TRY sellers to a 100-day SMA level of 7.5160.
During the quote’s sustained downside past-7.5160, 61.8% Fibonacci retracement, at 7.4100, will be the key support to watch.
USD/TRY daily chart
Trend: Further recovery expected
Reprinted from FXStreet,the copyright all reserved by the original author.
Disclaimer: The content above represents only the views of the author or guest. It does not represent any views or positions of FOLLOWME and does not mean that FOLLOWME agrees with its statement or description, nor does it constitute any investment advice. For all actions taken by visitors based on information provided by the FOLLOWME community, the community does not assume any form of liability unless otherwise expressly promised in writing.
FOLLOWME Trading Community Website: https://www.followme.com


Hot
No comment on record. Start new comment.