NZD/USD Price Analysis: At 23-month tops on NZ Retail Sales big beat, teasing key hurdle

- NZD/USD teasing rising wedge hurdle on the hourly chart.
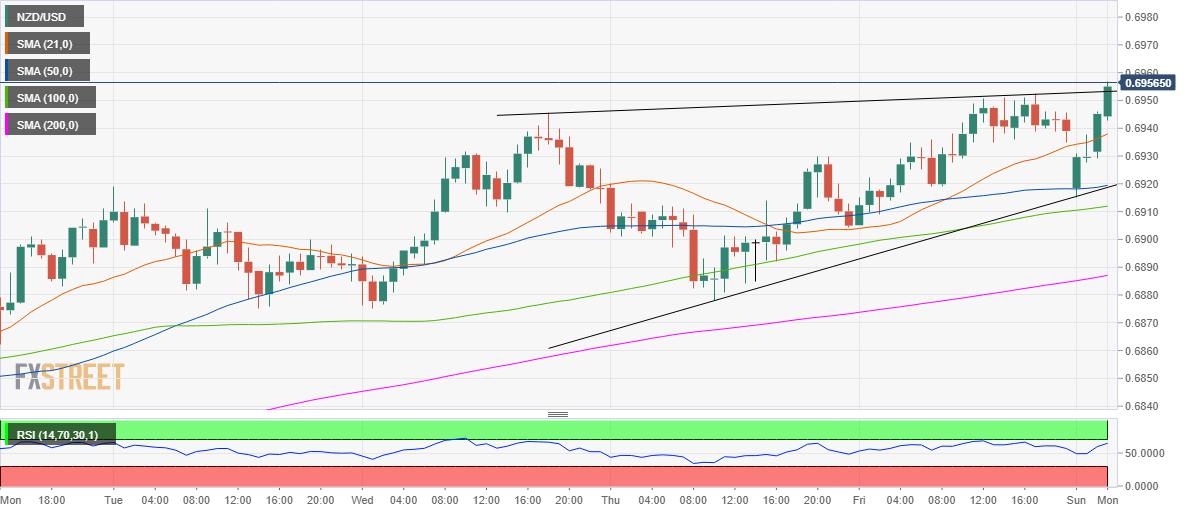
- Hourly RSI stays bullish and points north, further upside likely.
- 0.6919 is the level to beat for the kiwi bears.
NZD/USD extends its rally to hit the highest levels since December 2018 above 0.6950, as the bulls rejoice a big beat on New Zealand’s Retail Sales data.
The NZ retail consumer spending jumped by 28% QoQ in Q3 vs. 20% expected. Meanwhile, successful vaccine trials—led risk-on mood also adds to the strength in the Kiwi.
From a technical perspective, the spot caught a fresh bid-wave after it managed to hold the critical 50-hourly moving average support at 0.6919.
The bulls recaptured the 21-HMA support-turned-resistance, as it marched higher to test a potential rising wedge pattern’s upside barrier at 0.6953.
An hourly closing above the latter could open doors towards the December 2018 high of 0.6971 en route to the key 0.7000 level. The hourly Relative Strength Index (RSI) points higher within the bullish zone, supporting the case for the additional upside.
To the downside, immediate support is seen at 21-HMA, now at 0.6938. Acceptance below the last could put the strong cushion at 0.6919 at risk. That level is the intersection of the 50-HMA and rising trendline support.
The next downside target is seen at the 100-HMA, which is at 0.6911.
NZD/USD: Hourly chart
NZD/USD: Additional levels
Reprinted from FXStreet,the copyright all reserved by the original author.
Disclaimer: The content above represents only the views of the author or guest. It does not represent any views or positions of FOLLOWME and does not mean that FOLLOWME agrees with its statement or description, nor does it constitute any investment advice. For all actions taken by visitors based on information provided by the FOLLOWME community, the community does not assume any form of liability unless otherwise expressly promised in writing.
FOLLOWME Trading Community Website: https://www.followme.com


Hot
No comment on record. Start new comment.