Backtesting Gold in 2019

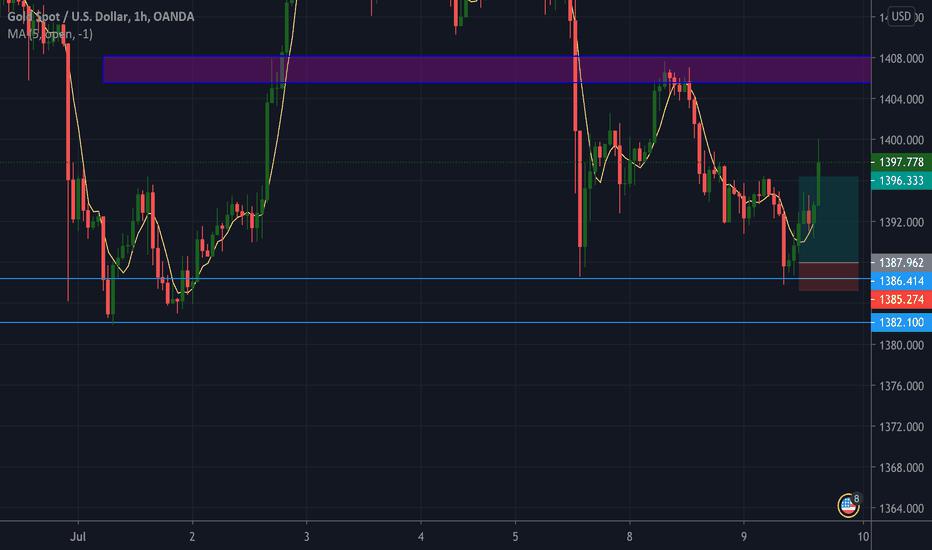
Looking at the Gold /USD hourly & 15 min charts on July 9th 2019. Gold has been in a bearish trend since July 3rd, after reaching 6 year high at 1438.900 zone. Going to a higher timeframe, in the daily, we see that price could Not top this high after attempting to breakthrough twice. Once on June 25th & again on July 3rd ( 5 candles in between).
Price has been creating lower highs & lower lows since the 3rd of July, indicating down trend. 3 bearish candles appear after not being able to break high. With price currently at 1397.778 I am now looking for sells down to the 1382.100 zone after retest.
Using the Fibonacci retracement tool, I will set my tp & sl respecting its support & resistance levels.
Disclaimer: The content above represents only the views of the author or guest. It does not represent any views or positions of FOLLOWME and does not mean that FOLLOWME agrees with its statement or description, nor does it constitute any investment advice. For all actions taken by visitors based on information provided by the FOLLOWME community, the community does not assume any form of liability unless otherwise expressly promised in writing.
FOLLOWME Trading Community Website: https://www.followme.com


Hot
No comment on record. Start new comment.