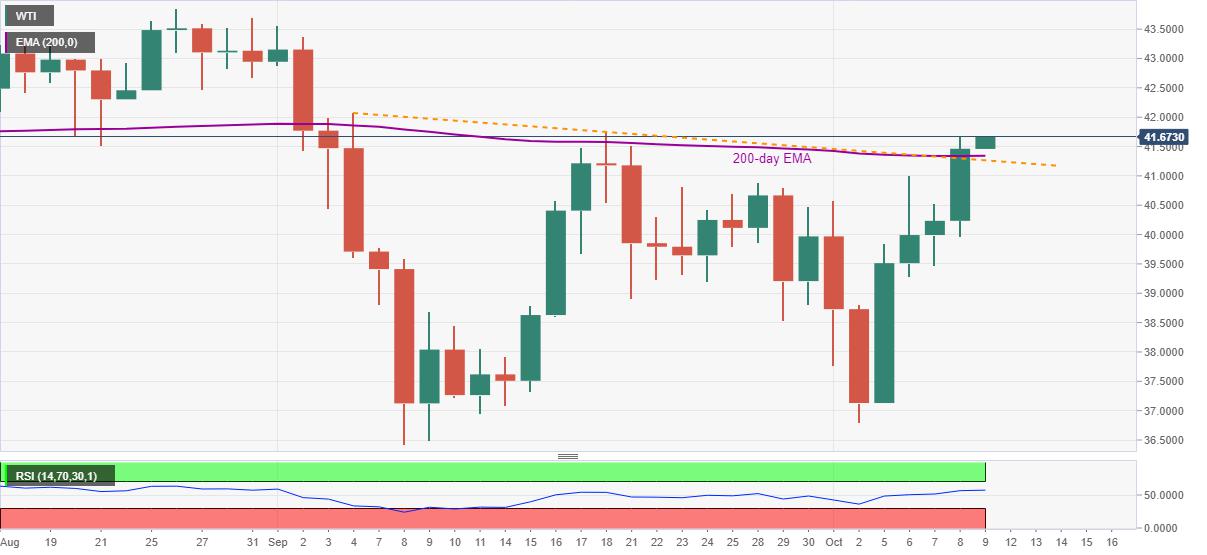
WTI Price Analysis: Cheering Upside Break of 200-Day EMA to Eye $42.00

- WTI refreshes three-week high while carrying the run-up beyond key EMA, falling trend line from September 04.
- Normal RSI conditions add to the bulls’ power in targeting the five-week top.
- Bears will have a bumpy road unless breaking the $40.00 round-figure.
- US sanctioning of 18 Iranian banks offer fundamental strength.
WTI extends Thursday’s heavy rise towards challenging the September 18 top, currently around $41.70, during the initial Asian session on Friday. In doing so, the energy benchmark respects the upside break of 200-day SMA and a five-week-long descending resistance line, now support.
The upside momentum also gains support from an absence of overbought RSI conditions. That said, oil prices are currently targeting the $42.00 round-figure ahead of September 04 top of $42.07.
Should energy bulls manage to cross $42.07, highs marked during September and August, respectively around $43.55 and $43.85, will be in the spotlight.
On the downside, 200-day EMA and the immediate support line, previous resistance, will restrict WTI’s immediate declines above $41.25. Also offering immediate support could be the September 28 peak surrounding $40.85 and the $40.00 psychological magnet.
I f at all the oil bears sneak in around $40.00, there are multiple supports around $38.70, $38.00 and near $37.00 that can challenge the black gold’s further weakness.
Other than the technical indicators, the US State Department’s announcement of levy fresh sanctions on 18 banks from Iran also suggest a disturbance in the oil supply and play positive for the quote.
WTI daily chart
Trend: Bullish
Reprinted from FXStreet,the copyright all reserved by the original author.
Disclaimer: The content above represents only the views of the author or guest. It does not represent any views or positions of FOLLOWME and does not mean that FOLLOWME agrees with its statement or description, nor does it constitute any investment advice. For all actions taken by visitors based on information provided by the FOLLOWME community, the community does not assume any form of liability unless otherwise expressly promised in writing.
FOLLOWME Trading Community Website: https://www.followme.com


Hot
-THE END-