Gold Price Analysis: XAU/USD defends Friday's low

- Gold bulls defend support of Friday's low of $1,897.
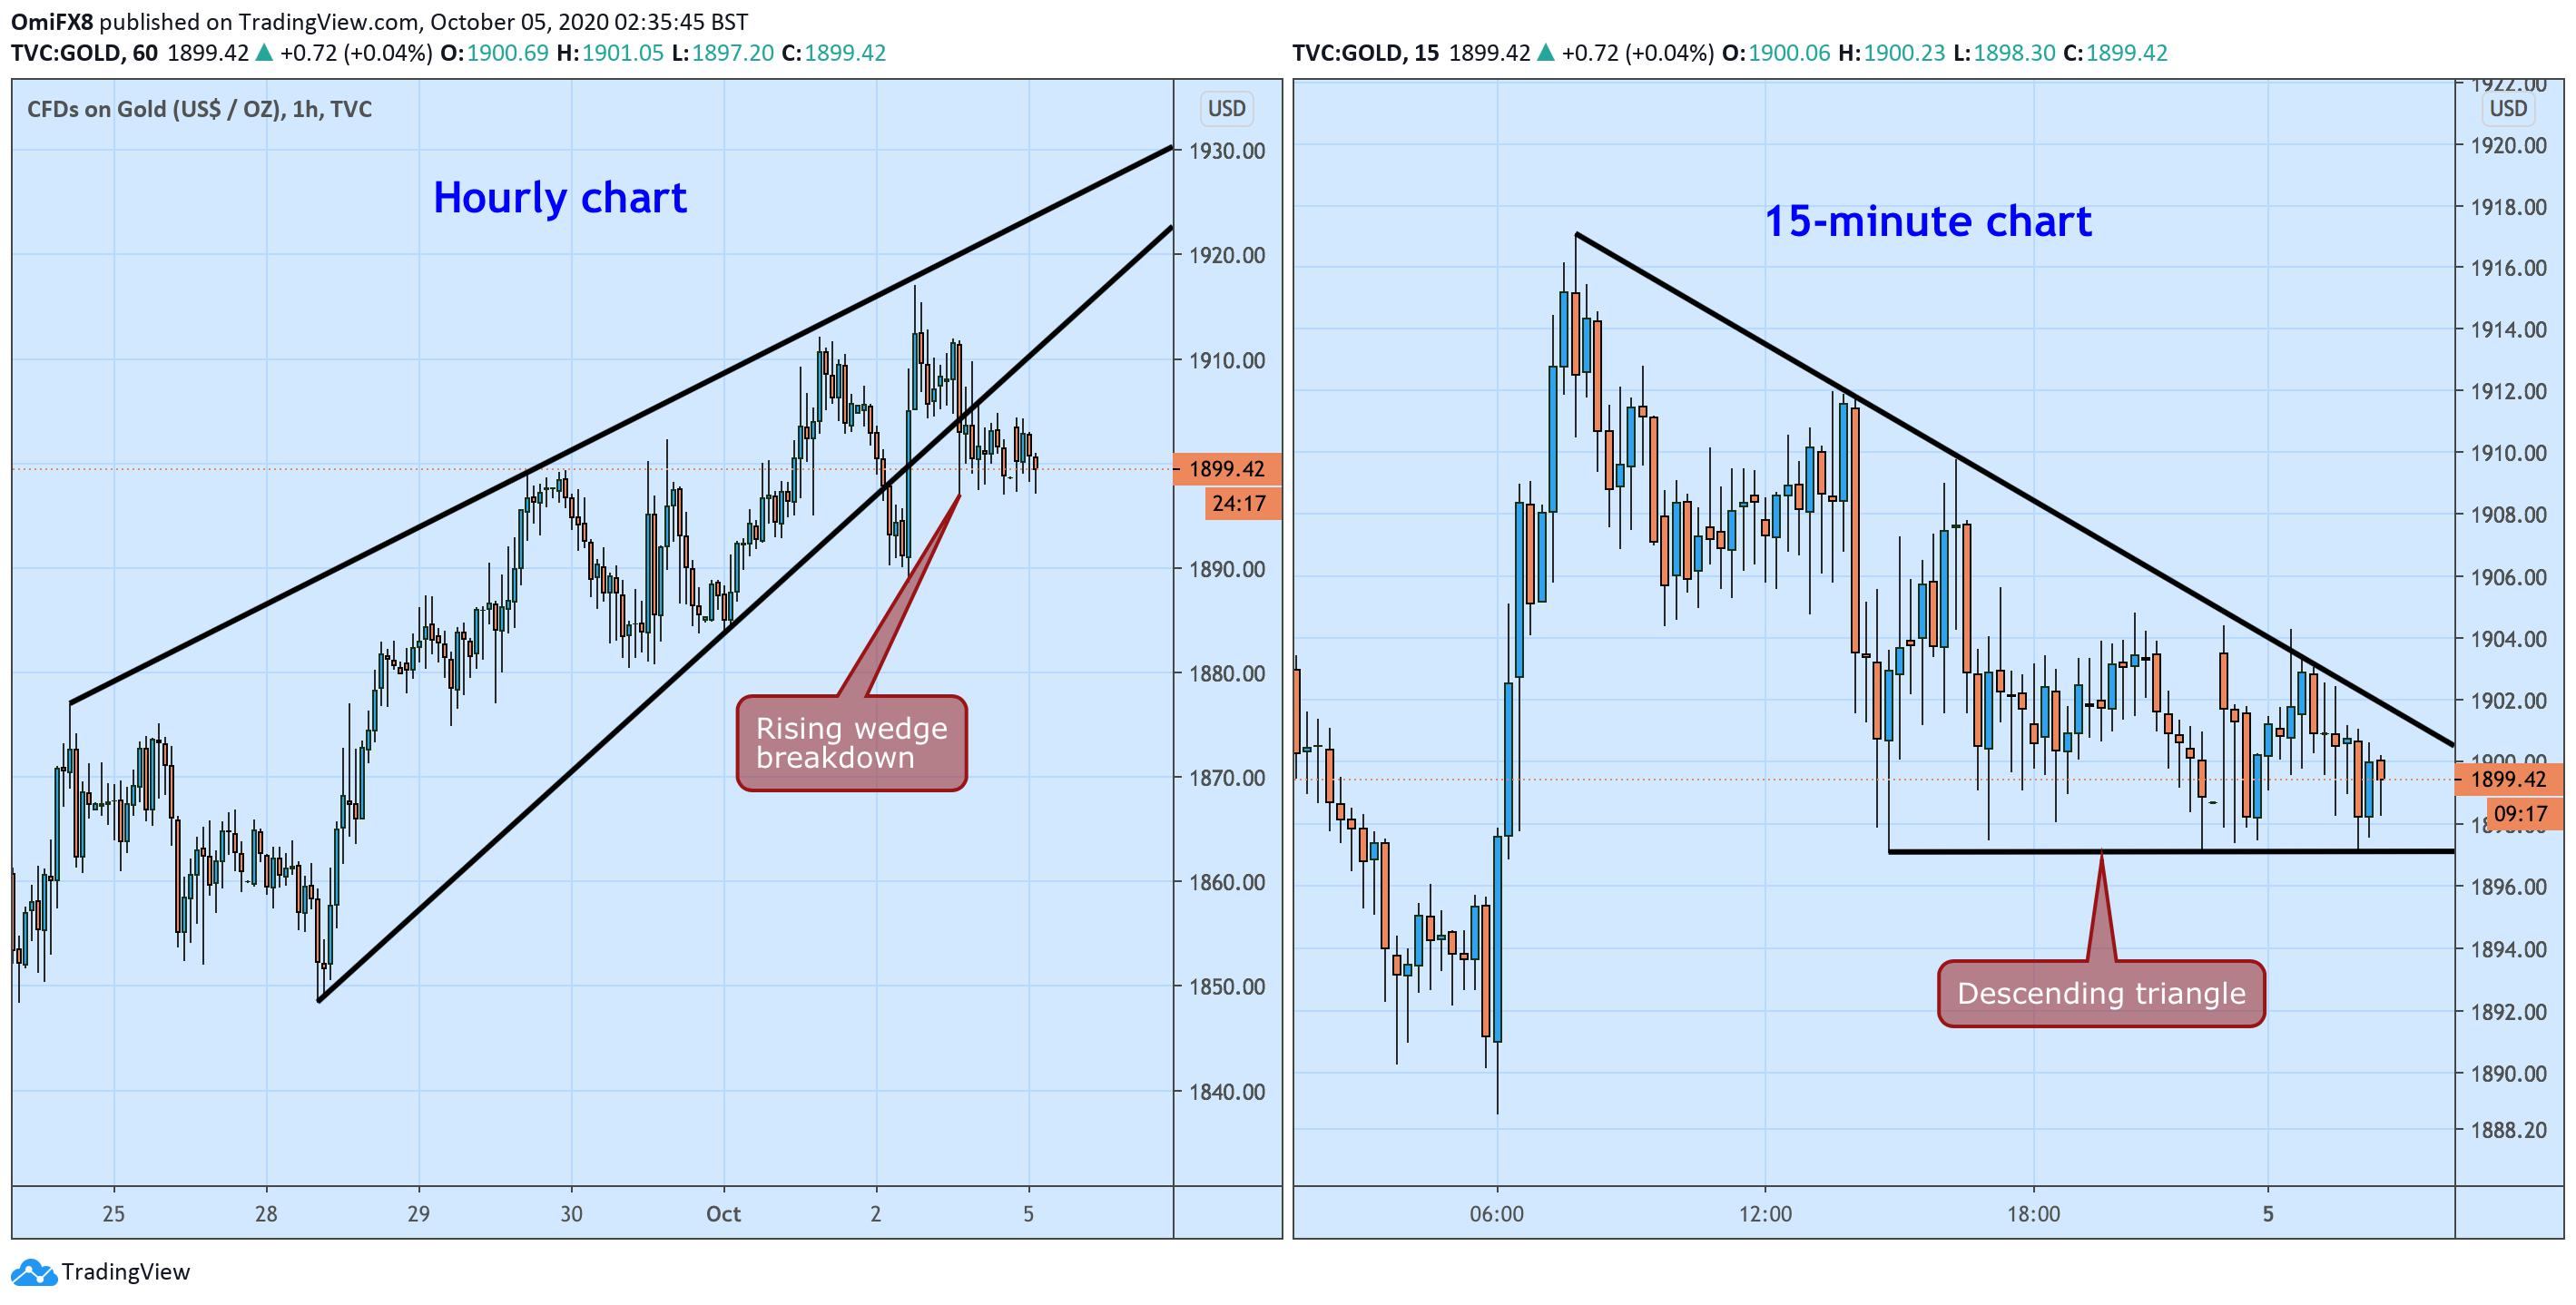
- The yellow metal is trapped in a descending triangle on the 15-minute chart.
While gold (XAU/USD) has bounced up from Friday's low of $1,897, the yellow metal is still trapped in a descending channel, as seen on the 15-minute chart.
A move above the top end of the triangle, currently at $1,903, would confirm a breakout and open the doors for the Oct. 2 high of $1,917.
Alternatively, acceptance below $1,897 – the lower end of the triangle – would reinforce the bearish view put forward by the hourly chart rising wedge breakdown confirmed on Friday and expose the 100-day SMA at $1,855.
At press time, gold is trading at $1,900 per ounce.
Hourly and 15-min charts
Trend: Neutral
Technical levels
Reprinted from FXStreet,the copyright all reserved by the original author.
Disclaimer: The content above represents only the views of the author or guest. It does not represent any views or positions of FOLLOWME and does not mean that FOLLOWME agrees with its statement or description, nor does it constitute any investment advice. For all actions taken by visitors based on information provided by the FOLLOWME community, the community does not assume any form of liability unless otherwise expressly promised in writing.
FOLLOWME Trading Community Website: https://www.followme.com


Hot
-THE END-