WTI Price Analysis: Rebounds from 16-week-old support line above $37.00

- WTI picks up bids toward $37.50 following its U-turn from the lowest in one month.
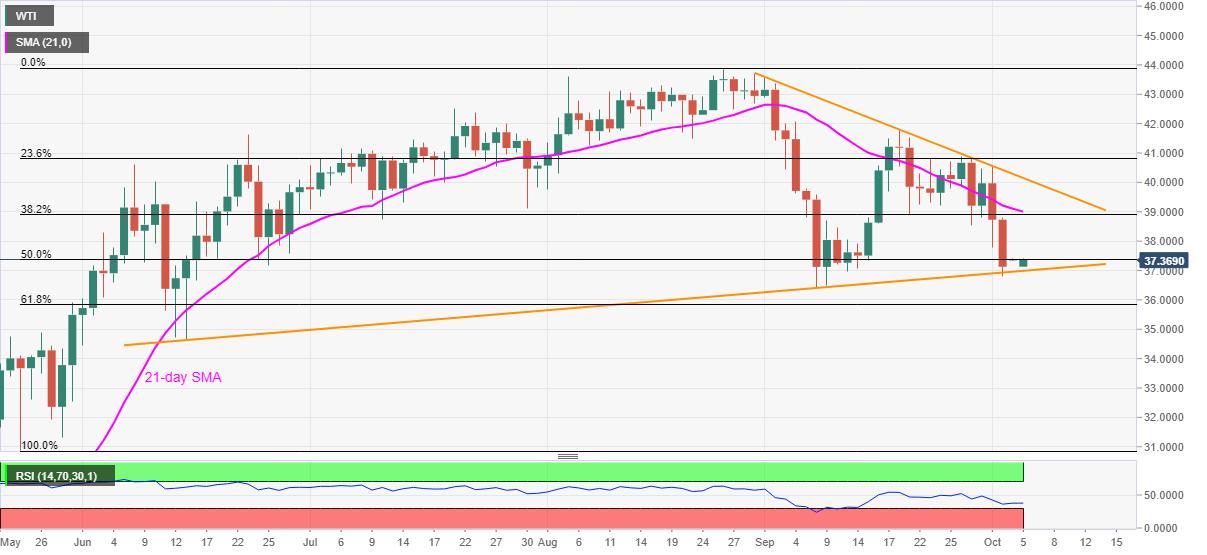
- 50% Fibonacci retracement offers immediate resistance ahead of $38.90-$39.00 key upside area.
- Sellers will target 61.8% Fibonacci retracement following the trend line break.
WTI rises to $37.40 during the pre-Tokyo open Asian trading on Monday. The black gold slumped to the lowest since September 09 on Friday but stepped back from closing below an ascending trend line connecting lows marked in mid-June and early September.
Also read: The Chart of the Week: WTI meets critical support, bears on the look out for a correction before lower
The buyers are currently attacking 50% Fibonacci retracement level of May 22 to August 26 run-up, near $37.40, a daily close beyond the same will aim for 38.2% Fibonacci retracement and 21-day SMA, close to $38.90-$39.00, during the further rise.
If at all the oil bulls remain dominant past-$39.00, the $4.00 round-figure and a downward sloping trend line from August 31, at $40.15 now, will be the key to watch.
Alternatively, the energy benchmark’s daily close below the stated support line, currently around $36.85, may take a rest near September month’s low of $36.43 before targeting the 61.8% Fibonacci retracement level of $35.82.
WTI daily chart
Trend: Pullback expected
Reprinted from FXStreet,the copyright all reserved by the original author.
Disclaimer: The content above represents only the views of the author or guest. It does not represent any views or positions of FOLLOWME and does not mean that FOLLOWME agrees with its statement or description, nor does it constitute any investment advice. For all actions taken by visitors based on information provided by the FOLLOWME community, the community does not assume any form of liability unless otherwise expressly promised in writing.
FOLLOWME Trading Community Website: https://www.followme.com


Hot
No comment on record. Start new comment.