NZD/USD Price Analysis: Kiwi negates bearish pattern with a move above 0.66

- NZD/USD closed above 0.66 on Wednesday, invalidating a double top bearish pattern.
- Daily chart indicators continue to call a bearish move.
The NZD/USD pair clocked a session high of 0.6628 a few minutes before press time, having closed above 0.66 on Wednesday.
The pair's break above 0.66 has invalidated the bearish double top breakdown pattern confirmed on Sept. 23.
That said, the 14-day relative strength index is still hovering in bearish territory below 50, and the MACD histogram remains below zero.
The bias would turn bullish once the RSI moves above 50, and the MACD turns positive. That would shift risk in favor of a re-test of the psychological level of 0.68.
The immediate support is seen at 0.66, which, if breached, would put the bears back into the driver's seat and expose the Aug. 20 low of 0.6489.
Daily chart
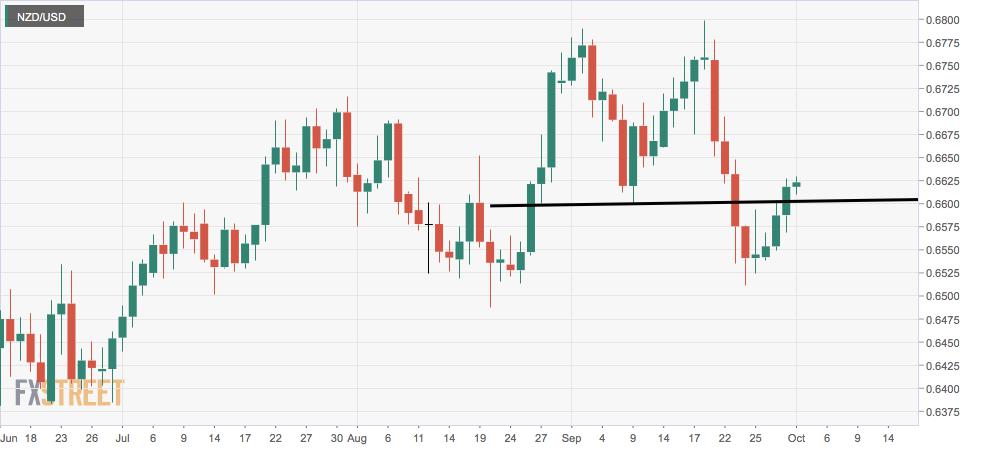
Trend: Neutral
Technical levels
Reprinted from FXStreet,the copyright all reserved by the original author.
Disclaimer: The content above represents only the views of the author or guest. It does not represent any views or positions of FOLLOWME and does not mean that FOLLOWME agrees with its statement or description, nor does it constitute any investment advice. For all actions taken by visitors based on information provided by the FOLLOWME community, the community does not assume any form of liability unless otherwise expressly promised in writing.
FOLLOWME Trading Community Website: https://www.followme.com


Hot
No comment on record. Start new comment.