GBP/USD Price Analysis: No major takers for Thursday’s bearish spinning top

- GBP/USD wavers below 1.2900 after snapping a three-day winning streak the previous day.
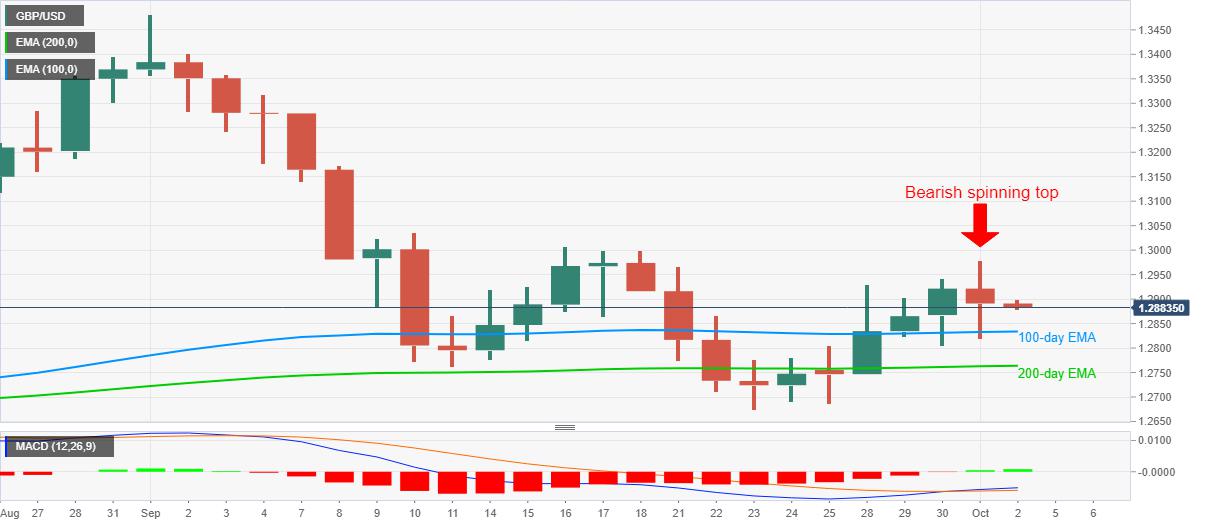
- The key EMAs probe bearish candlestick formation, MACD turns strongest in a month.
- Mid-September tops add to the upside barriers past-1.2980.
GBP/USD drops to 1.2880 as markets in Tokyo open for Friday’s trading. Even so, the quote stays mostly unchanged on a daily basis. The pair took a U-turn from 1.2819 to refresh a two week high the previous day. Though, following stabilization below the 1.2900 mark flashed the bearish spinning top candlestick on the daily chart.
Even so, 100-day and 200-day EMA offer the key support to the GBP/USD prices while MACD flashes the strongest bullish signals since early September.
Hence, the pair’s latest weakness may extend towards 100-day EMA near 1.2830. Though, any further downside will be restricted by the 200-day EMA level of 1.2763.
If at all the GBP/USD sellers conquer 1.276 support, the September month’s bottom close to 1.2675 will challenge the pair’s additional south-run.
On the flip side, a daily close beyond Thursday’s high of 1.2978 can aim for the September 16 peak surrounding 1.3010 and September 10 high of 1.3035 during the further recovery.
GBP/USD daily chart
Trend: Sideways
Reprinted from FXStreet,the copyright all reserved by the original author.
Disclaimer: The content above represents only the views of the author or guest. It does not represent any views or positions of FOLLOWME and does not mean that FOLLOWME agrees with its statement or description, nor does it constitute any investment advice. For all actions taken by visitors based on information provided by the FOLLOWME community, the community does not assume any form of liability unless otherwise expressly promised in writing.
FOLLOWME Trading Community Website: https://www.followme.com


Hot
-THE END-