Silver Price Analysis: On the back foot below 10-day SMA

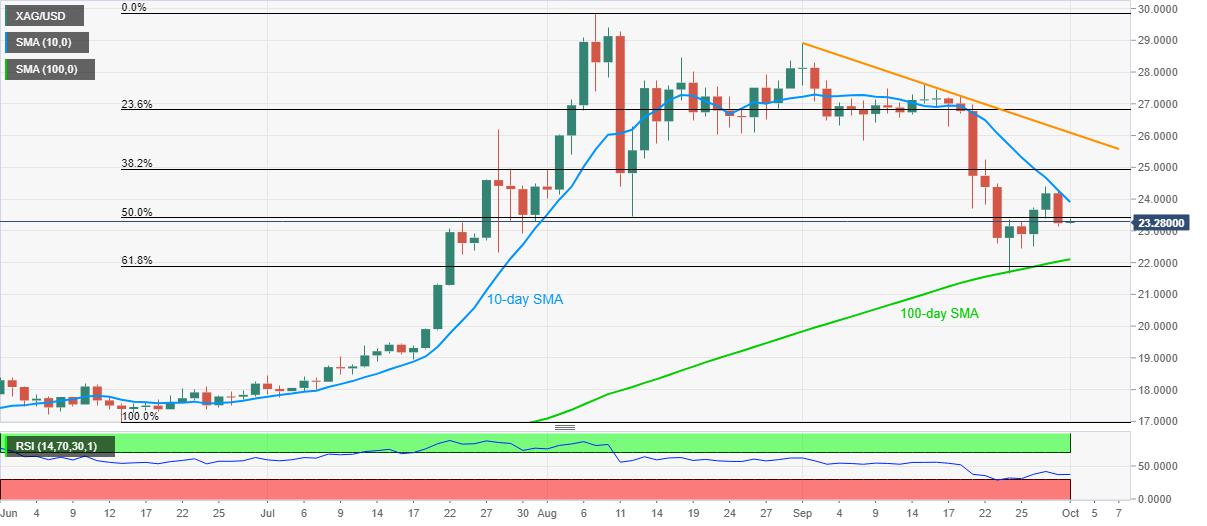
- Silver prices stay heavy above $23.00, keep Wednesday’s pullback from 10-day SMA.
- Downside break of 50% Fibonacci retracement again highlights 100-day SMA support.
- Early September low, one-month-old falling trend line add to the upside barriers.
Silver prices decline to $23.25 during Thursday’s Asian session. The white metal took a U-turn from 10-day SMA the previous day while closing below 50% Fibonacci retracement level of its June-August upside.
Hence, sellers are currently eyeing a downside break of the $23.00 threshold to revisit the 100-day SMA level of $22.10.
However, silver bears will have a tough time past-$22.10 as the $22.00 round-figure and 61.8% of Fibonacci retracement near $21.90 will challenge the metal’s further downside.
Meanwhile, an upside clearance of 10-day SMA, currently around $23.90, will need validation from $24.00 to aim for September 08 low near $25.85.
Also acting as the tough resistance is the falling trend line from September 01, at $26.08 now.
Silver daily chart
Trend: Bearish
Reprinted from FXStreet,the copyright all reserved by the original author.
Disclaimer: The content above represents only the views of the author or guest. It does not represent any views or positions of FOLLOWME and does not mean that FOLLOWME agrees with its statement or description, nor does it constitute any investment advice. For all actions taken by visitors based on information provided by the FOLLOWME community, the community does not assume any form of liability unless otherwise expressly promised in writing.
FOLLOWME Trading Community Website: https://www.followme.com


Hot
-THE END-