USD/CAD Price Analysis: Bulls cheer inverse head-and-shoulders confirmation to attack 1.3300

- USD/CAD keeps the 25-pip range between 1.3295 and 1.3320 while probing the August 12 high.
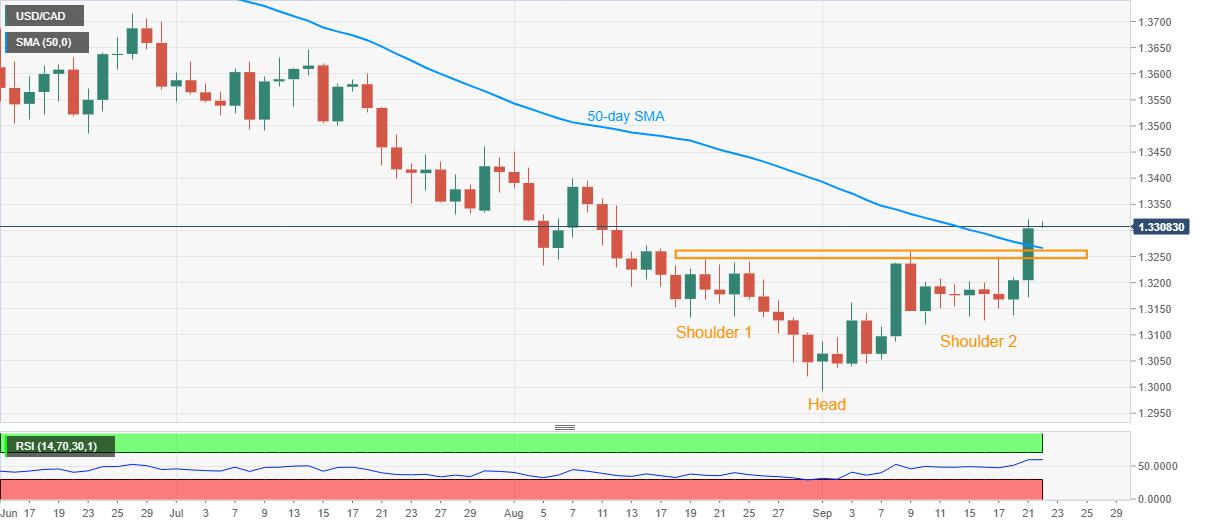
- Buyers rely on the confirmation of a bullish chart pattern, 50-day SMA also strengthens the neckline support.
USD/CAD seesaws around 1.3310 amid the initial Asian trading on Tuesday. The loonie major confirmed a bullish chart pattern the previous day while rising to the highest in over 1.5 months.
Considering the absence of the overbought RSI conditions and sustained trading beyond the neckline of stated inverse head-and-shoulders, bulls are likely to keep reins.
As a result, August month’s top near 1.3400 becomes the immediate resistance on optimists’ radar whereas the July 30 peak around 1.3460 can challenge the buyers afterward.
If at all USD/CAD remains positive beyond 1.3460, the late-June bottom surrounding 1.3485 can offer an intermediate halt during the rise to the 1.3500 threshold.
Alternatively, the pair’s 50-day SMA adds strength to the 1.3265/45 neckline area that becomes the key support for sellers to watch.
Should USD/CAD prices drop below 1.3245 on a daily closing, the mid-September bottom close to 1.3130/25 will be in the spotlight.
USD/CAD daily chart
Trend: Bullish
Reprinted from FXStreet,the copyright all reserved by the original author.
Disclaimer: The content above represents only the views of the author or guest. It does not represent any views or positions of FOLLOWME and does not mean that FOLLOWME agrees with its statement or description, nor does it constitute any investment advice. For all actions taken by visitors based on information provided by the FOLLOWME community, the community does not assume any form of liability unless otherwise expressly promised in writing.
FOLLOWME Trading Community Website: https://www.followme.com


Hot
No comment on record. Start new comment.