Natural Gas Weekly Forecast

This/Next Week Forecast
(September 21 - 25, 2020)
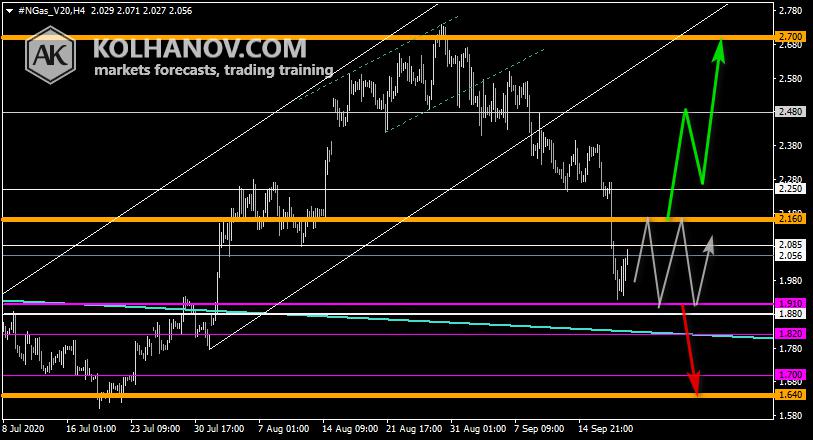
Uptrend scenario
An uptrend will start as soon, as the market rises above resistance level 2.160, which will be followed by moving up to resistance level 2.480 and 2.700.
Downtrend scenario
The downtrend may be expected to continue in case the market drops below support level 1.910, which will be followed by reaching support level 1.640.
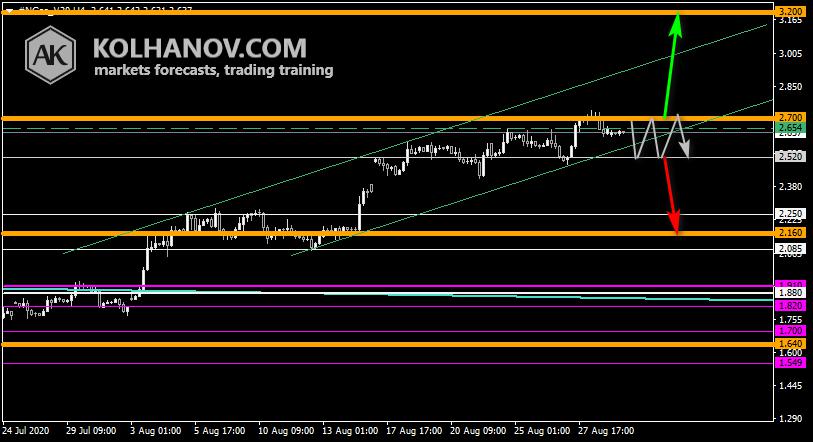
previous week natural gas forecast chart
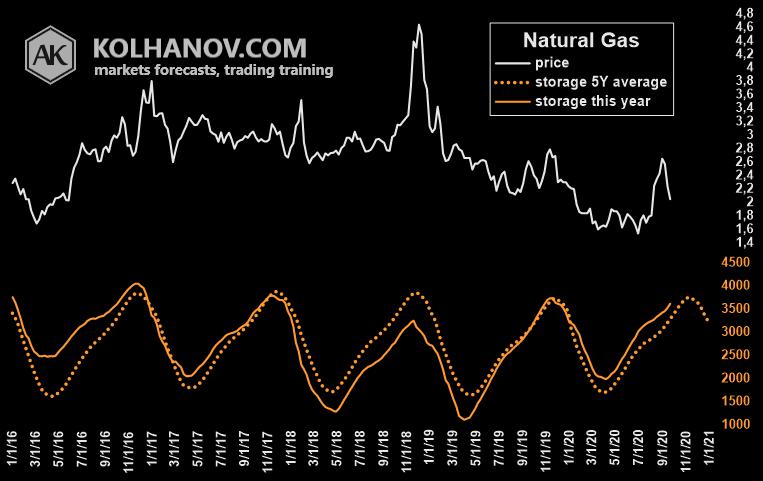
Fundamental Analysis
Difference between supply and demand shows oversold market and fair price at the level $2.7. Before November demand is temporarily felt, that pushed price down, but after few first cold weeks market will go up back to the target level $2.7.
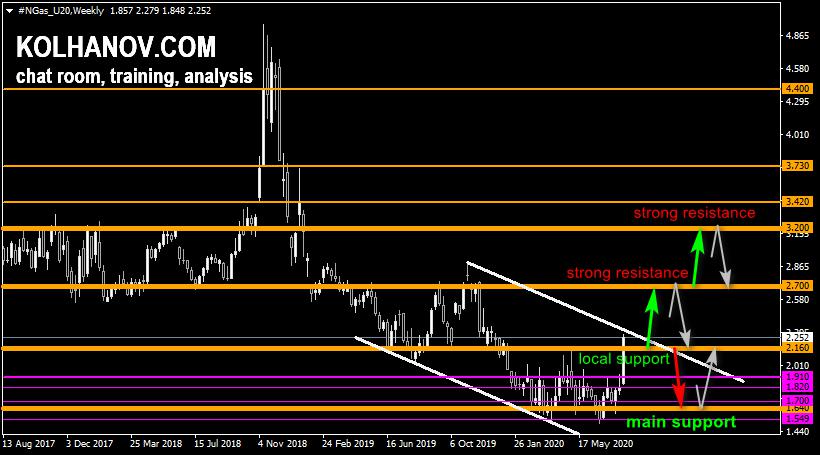
Long-Term Forecast
(Quarter III: July - September, 2020)
Uptrend scenario
The uptrend may be expected to continue, while market is trading above support level 2.160, which will be followed by reaching resistance level 2.700.
Downtrend scenario
An downtrend will start as soon, as the market drops below support level 2.160, which will be followed by moving down to support level 1.640.
Reprinted from FXStreet,the copyright all reserved by the original author.
Disclaimer: The content above represents only the views of the author or guest. It does not represent any views or positions of FOLLOWME and does not mean that FOLLOWME agrees with its statement or description, nor does it constitute any investment advice. For all actions taken by visitors based on information provided by the FOLLOWME community, the community does not assume any form of liability unless otherwise expressly promised in writing.
FOLLOWME Trading Community Website: https://www.followme.com


Hot
No comment on record. Start new comment.