Liquidity is What is gold doing - A Smart Money Tutorial

Follow along with me here since I posted my last idea about this (see my linked ideas) Gold has done some interesting stuff. And now that I've had time to digest it, I understand what's going on (kinda).
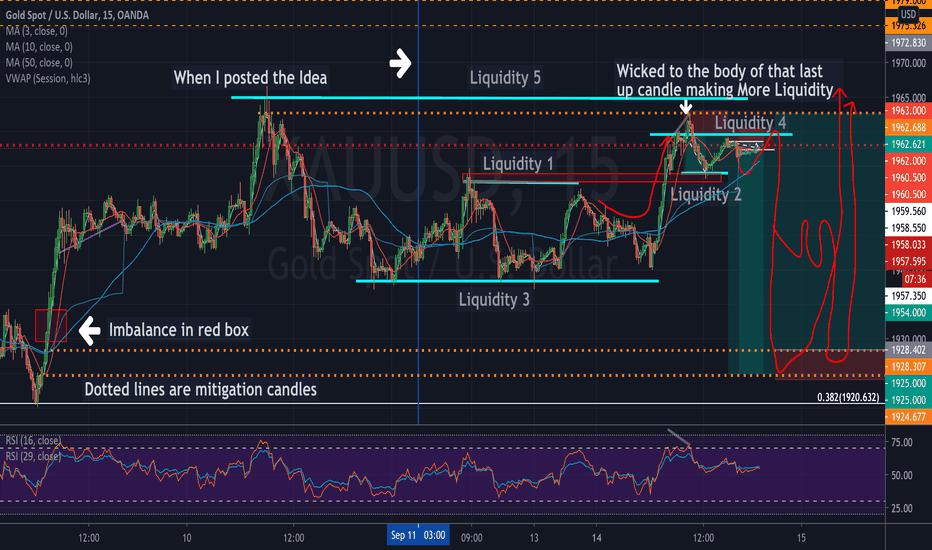
My last Idea said there were bear candles that haven't been mitigated. This is a buy-to-sell or sell-to-buy candle that institutions do to either take out liquidity or create a better position to make more profit (if the make a large sell and it drops them 50 Pips, they quadruple their order to buy it convinces everyone else to buy, thus the banks make more money) But they're still holding that sell position. And that's the candle that needs to be mitigated. Meaning they need to get back to that candle so they can release their sell position so they are not in draw down anymore. and banks and institutions trade with millions of dollars so they can afford all of that draw down, but they don't want to lose that profit. So there is always game of mitigating candles. And with gold it's been happening a lot with the last down candle from the major 1000 point drop in one day. If you follow all of the down candles you'll be able to spot them, but I digress.
Now, they still haven't mitigated the candle mentioned in the linked idea. And instead of mitigating them first Gold created a lot of liquidity and went straight for that liquidity. Now, Liquidity is where the money is, where people have their sell/buy limits, sell/buy stops set and their stop losses. Because once you hit a limit or an area someone would want to market execute, then you have liquidity. Typically these are highs lows, or equal highs and lows of a schematic. In this markup all of the blue lines represent where liquidity is (was in one case), because that's where you would set your limits and expect them to go the opposite direction, Amirite? Well the banks now this. So they will create these areas on purpose and go straight through them to take your money. Look at Liquidity 1 and then look at the red line I have showing the price action shooting up straight through that.

Disclaimer: The content above represents only the views of the author or guest. It does not represent any views or positions of FOLLOWME and does not mean that FOLLOWME agrees with its statement or description, nor does it constitute any investment advice. For all actions taken by visitors based on information provided by the FOLLOWME community, the community does not assume any form of liability unless otherwise expressly promised in writing.
FOLLOWME Trading Community Website: https://www.followme.com


Hot
-THE END-