GBP/USD Price Analysis: 50-day SMA probes the heaviest losses in six months

- GBP/USD bears catch a breather at six-week low, dropped nearly 200-pips on Tuesday.
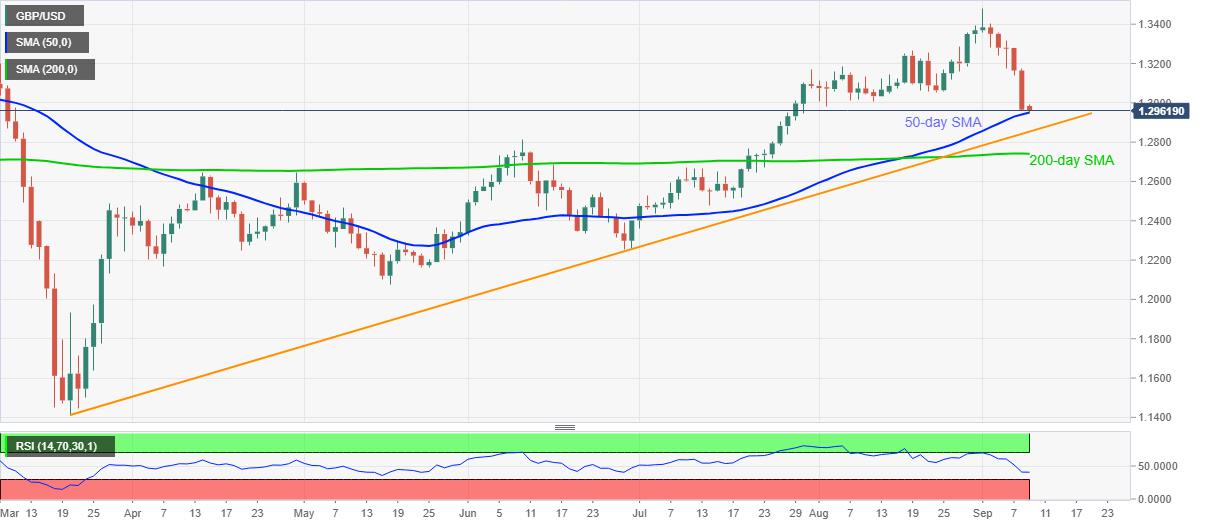
- An ascending trend line from March 20, June month’s high add to the support.
- Bulls need a clear break of late-August low to attempt recovery moves.
GBP/USD retraces from the multi-day low of 1.2950 to 1.2962 during the pre-Tokyo open trading on Wednesday. The Cable marked heaviest losses since March 18 the previous day as Brexit pessimism took over. However, failures to break 50-day SMA, needless to mention about an ascending trend line from late-March and June month’s top, suggest further consolidation of the quote.
Though, the 1.3000 threshold and August 24 low near 1.3050/55 guard the pair’s immediate upside ahead of March month’s peak of 1.3200.
Additionally, the pair’s sustained run-up past-1.3200 will confront the 1.3265/70 resistance area ahead of challenging the monthly high surrounding 1.3480.
On the contrary, a downside break of 50-day SMA, at 1.2950 now, will have a bumpy road ahead as a multi-day-old support line and June month’s peak can question the bears around 1.2850 and 1.2810 respectively.
Even if the sellers conquer 1.2810, 200-day SMA close to 1.2740 will add filters to the further declines.
GBP/USD daily chart
Trend: Pullback expected
Reprinted from FXStreet,the copyright all reserved by the original author.
Disclaimer: The content above represents only the views of the author or guest. It does not represent any views or positions of FOLLOWME and does not mean that FOLLOWME agrees with its statement or description, nor does it constitute any investment advice. For all actions taken by visitors based on information provided by the FOLLOWME community, the community does not assume any form of liability unless otherwise expressly promised in writing.
FOLLOWME Trading Community Website: https://www.followme.com


Hot
-THE END-