Silver Price Analysis: Pullback from fresh 6.75-year high teases short-term rising wedge

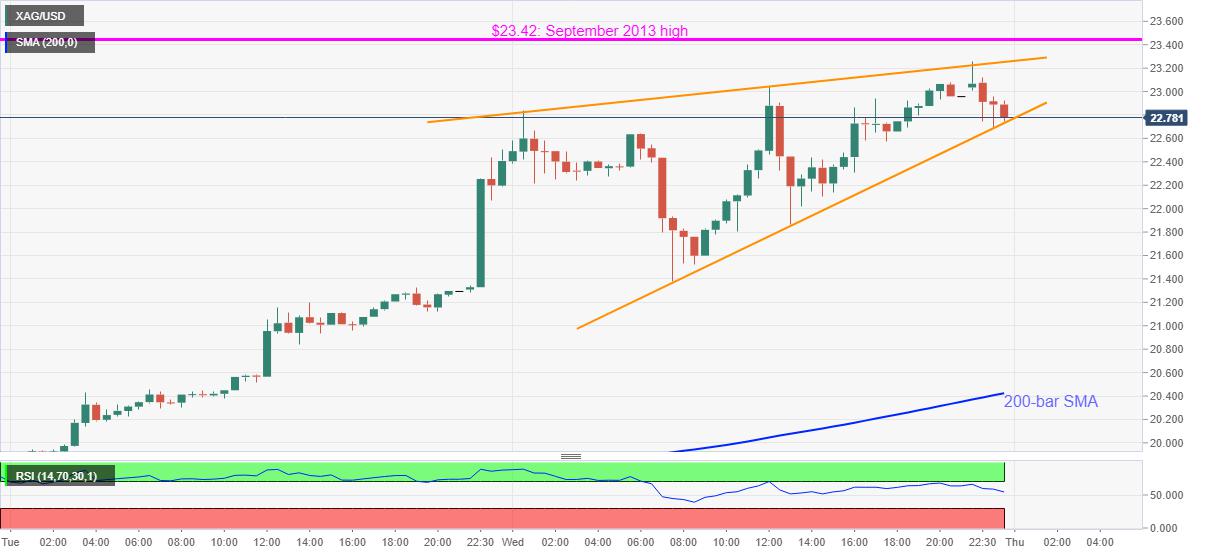
- Silver prices recede after crossing the October 2013 peak with a high of $23.26.
- Confirmation of a bearish chart pattern will recall the sub-$22.00 area.
- Bulls will have to cross September 2013 top to extend the north-run.
Silver prices mark depression around $22.88 during the initial Asian trading on Thursday. The white metal surged to the highest since September 2013 before an hour but upside momentum fizzled afterward. Hence, a short-term rising wedge formation appears on the 30-minute chart, which in turn keeps the sellers hopeful near the multi-year high.
Though the bears will have to wait for a clear downside break past-$22.70 to confirm the commodity’s further weakness. Following that, the late-Wednesday low near $21.38 will be in the spotlight.
In a case where the quote remains weak below $21.38, $21.00 and 200-bar SMA level of $20.42 can act as buffers before highlighting the $20.00 threshold as the key support.
Alternatively, $23.00 could question the metal’s immediate upside ahead of the recent high and bearish pattern’s resistance line near $23.25.
It should, however, be noted that the quote’s rise past-$23.25 will have to pass through September 2013 peak surrounding $23.42 to attack $24.00.
Silver 30-minute chart
Trend: Pullback expected
Reprinted from FXStreet,the copyright all reserved by the original author.
Disclaimer: The content above represents only the views of the author or guest. It does not represent any views or positions of FOLLOWME and does not mean that FOLLOWME agrees with its statement or description, nor does it constitute any investment advice. For all actions taken by visitors based on information provided by the FOLLOWME community, the community does not assume any form of liability unless otherwise expressly promised in writing.
FOLLOWME Trading Community Website: https://www.followme.com


Hot
No comment on record. Start new comment.