US Dollar Index Price Analysis: Potential test of the 96.00 area

- DXY remains under pressure amidst prevailing risk-on trends.
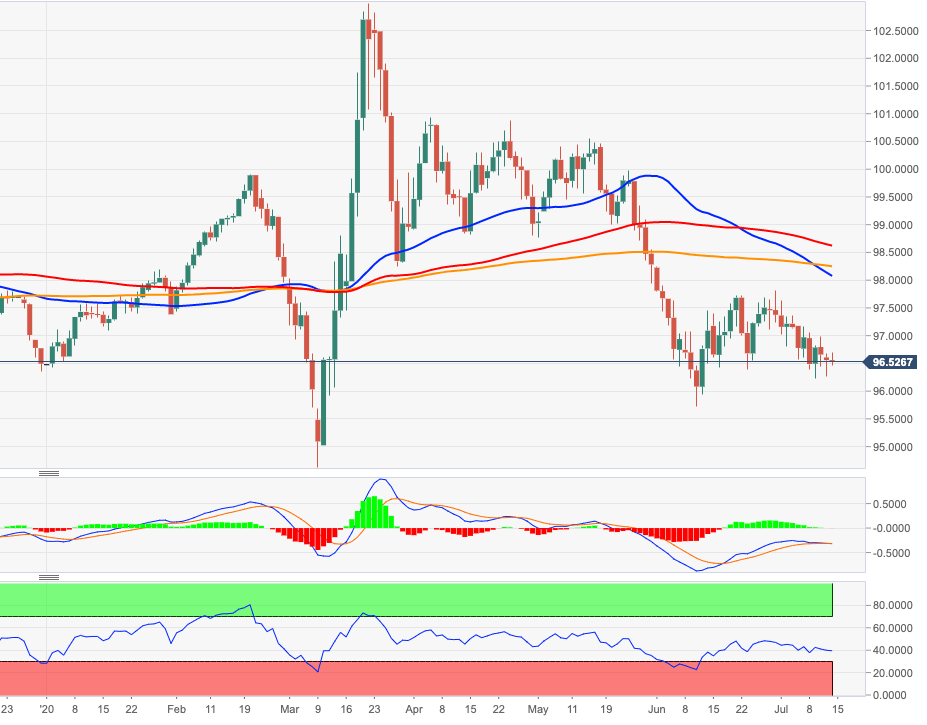
- Further declines now expose the Fibo level in the 96.00 zone.
DXY is alternating gains with losses in the 96.60 region on Tuesday, always against the backdrop of solid risk appetite trends favouring the risk complex.
The continuation of the decline is predicted to put the Fibo level (of the 2017-2018 drop) just above 96.00 to the test ahead of a potential leg lower to June’s low at 95.71.
The negative outlook on the dollar is expected to remain unaltered while below the 200-day SMA, today at 98.24.
DXY daily chart
Reprinted from FXStreet,the copyright all reserved by the original author.
Disclaimer: The content above represents only the views of the author or guest. It does not represent any views or positions of FOLLOWME and does not mean that FOLLOWME agrees with its statement or description, nor does it constitute any investment advice. For all actions taken by visitors based on information provided by the FOLLOWME community, the community does not assume any form of liability unless otherwise expressly promised in writing.
FOLLOWME Trading Community Website: https://www.followme.com


Hot
No comment on record. Start new comment.