Gold Price Futures (GC) Technical Analysis – Recent Price Action Indicates $1780.90 is Level to Watch

https://www.fxempire.com/forec...
The 50% level at $1780.90 is controlling the near-term direction of the market. Closing above this level makes it support early Monday.
Gold posted a wicked two-sided trade on Thursday, first plunging to its low of the session following the release of the U.S. Non-Farm Payrolls and weekly initial claims reports then surging to its high of the session as demand for higher risk assets started to weaken.
The U.S. Non-Farm Payrolls report was perceived as bullish because the payrolls change and unemployment rate came in better than expected. This triggered the sell-off in gold because it dampened the need for additional stimulus from the government and the Federal Reserve.
After some thought, traders determined that the weekly initial claims report was potentially bearish for the economy because it represents the future, while the NFP report is old news. If COVID-19 cases continue to rise and the U.S. starts to shut down parts of its economy then initial claims will rise. Investors will start shedding equities and gold will probably go up. Additionally, a weak jobs market will prompt the Fed to take stimulus action and maybe the government will kick in additional stimulus. Both moves will be potentially bullish for gold prices.
On Friday, August Comex gold settled at $1790.00.
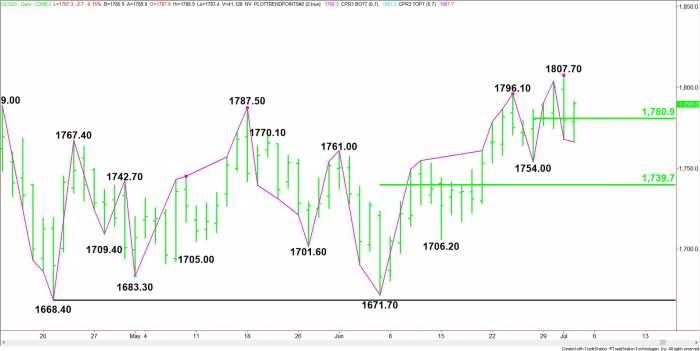
Daily August Comex Gold
Daily Swing Chart Technical Analysis
The main trend is up according to the daily swing chart, however, momentum is showing signs of shifting to the downside with the formation of the closing price reversal top on July 1.
A trade through $1807.70 will negate the closing price reversal top and signal a resumption of the uptrend. The main trend will change to down on a move through $1754.00.
The minor range is $1754.00 to $1807.70. Its 50% level or pivot at $1780.90 is controlling the near-term direction of the market. Closing above this level makes it support early Monday.
The short-term range is $1671.70 to $1807.70. If the short-term trend changes to down then look for a break into its 50% level at $1739.70.
Short-Term Outlook
On the daily chart, trader reaction to $1780.90 will likely determine the near-term direction of the market. Fundamentally, risk sentiment will be the catalyst behind the next move. The risk sentiment will be driven by the economic data, the most important being the Weekly Initial Claims report.
The Weekly Jobless Claims report will be the key report to watch because it’s weekly, while the other major reports are monthly. It will be the earliest indicator of problems in the economy.
Reprinted from FX Empire. The Copyright all reserved by the original author.
Disclaimer: The content above represents only the views of the author or guest. It does not represent any views or positions of FOLLOWME and does not mean that FOLLOWME agrees with its statement or description, nor does it constitute any investment advice. For all actions taken by visitors based on information provided by the FOLLOWME community, the community does not assume any form of liability unless otherwise expressly promised in writing.
FOLLOWME Trading Community Website: https://www.followme.com


Hot
No comment on record. Start new comment.