Gold Price Analysis: Trapped between two key barriers as US celebrates Independence Day – Confluence Detector

Gold saw a wild ride yet again on Thursday but held onto the higher ground despite the blockbuster US NFP data. Growing coronavirus cases worldwide continued to boost the safe-haven. US Independence Day celebrations to keep Gold subdued?
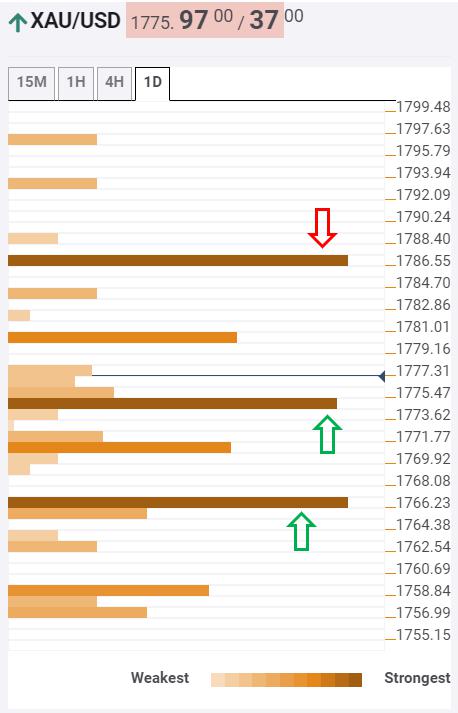
The Technical Confluences Indicator shows that the battle lines are well-defined for the yellow metal despite the sharp reversal seen a day before.
Therefore, the bulls are likely to challenge a minor barrier near $1780 on its next leg up, which is the convergence of the previous week as well as the previous day high.
Acceptance above the latter could open doors towards the next strong resistance aligned at $1786.50, the confluence of the previous month high and pivot point one-week R1.
A sustained break above the aforesaid hurdle will revive the momentum for a test of the $1800 mark.
On the other, should the bears succeed in taking out the health support at $1774 (SMA 100 on one-hour, Fibonacci 23.6% one-day and Bollinger Band one-hour Middle), selling pressure will likely intensify.
Although minor support at $1770 could slow down the declines. That level is the Fibonacci 23.6% one-week.
The next support at $1767 is the level to beat for the bears, where the Fibonacci 38.2% one-week, Fibonacci 61.8% one-day and SMA 10 on one-day coincide.
Here is how it looks on the tool
Confluence Detector
The Confluence Detector finds exciting opportunities using Technical Confluences. The TC is a tool to locate and point out those price levels where there is a congestion of indicators, moving averages, Fibonacci levels, Pivot Points, etc. Knowing where these congestion points are located is very useful for the trader, and can be used as a basis for different strategies.
This tool assigns a certain amount of “weight” to each indicator, and this “weight” can influence adjacents price levels. These weightings mean that one price level without any indicator or moving average but under the influence of two “strongly weighted” levels accumulate more resistance than their neighbors. In these cases, the tool signals resistance in apparently empty areas.
Reprinted from FXStreet,the copyright all reserved by the original author.
Disclaimer: The content above represents only the views of the author or guest. It does not represent any views or positions of FOLLOWME and does not mean that FOLLOWME agrees with its statement or description, nor does it constitute any investment advice. For all actions taken by visitors based on information provided by the FOLLOWME community, the community does not assume any form of liability unless otherwise expressly promised in writing.
FOLLOWME Trading Community Website: https://www.followme.com


Hot
No comment on record. Start new comment.