USD/CHF Price Analysis: Eases from monthly resistance line inside immediate triangle
- USD/CHF extends losses from 0.9508 following the pullback from a four-week-old resistance line.
- June 12 top, key Fibonacci retracements add upside barriers.
- The triangle’s downside break can refresh monthly low.
USD/CHF dwindles to 0.9470, down 0.10% on a day, during the pre-European session on Monday. The pair recently took a U-turn from a descending trend line from May 27. Before that, the quote reversed from the resistance line of a short-term symmetrical triangle formation.
In both the cases, the pair is likely to extend weakness towards the said triangle pair’s support, at 0.9440 now. However, a clear downside break will need validation from June 23 low near 0.9420 before attacking the monthly bottom surrounding 0.9375.
During the pair’s further rule after 0.9375, 0.9320 and 0.9270 could entertain the bears ahead of highlighting the yearly bottom surrounding 0.9180 on the sellers’ radar.
Alternatively, 0.9480 mark comprising the monthly resistance can guard the pair’s nearby recovery moves ahead of the triangle’s upper line, currently around 0.9500.
Also acting as upside barriers could be the June 12 high and 50% Fibonacci retracement level of May-June fall, respectively around 0.9555 and 0.9580.
USD/CHF four-hour chart
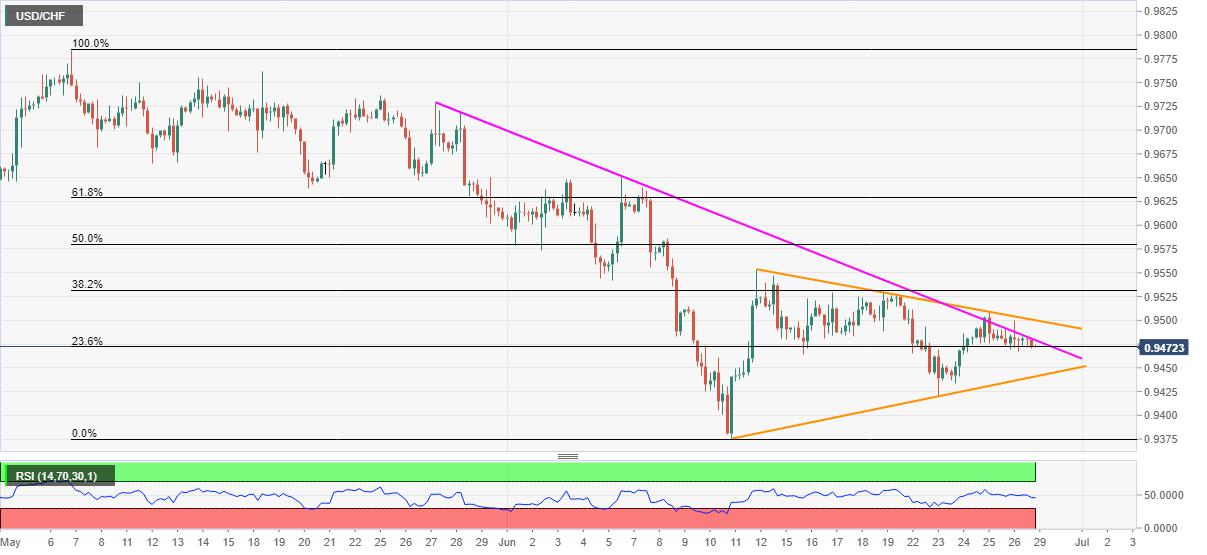
Trend: Further weakness expected
Reprinted from FXStreet,the copyright all reserved by the original author.
Disclaimer: The content above represents only the views of the author or guest. It does not represent any views or positions of FOLLOWME and does not mean that FOLLOWME agrees with its statement or description, nor does it constitute any investment advice. For all actions taken by visitors based on information provided by the FOLLOWME community, the community does not assume any form of liability unless otherwise expressly promised in writing.
FOLLOWME Trading Community Website: https://www.followme.com


Hot
No comment on record. Start new comment.