USD/CHF Price Analysis: Sluggish above 0.9500 inside weekly symmetrical triangle

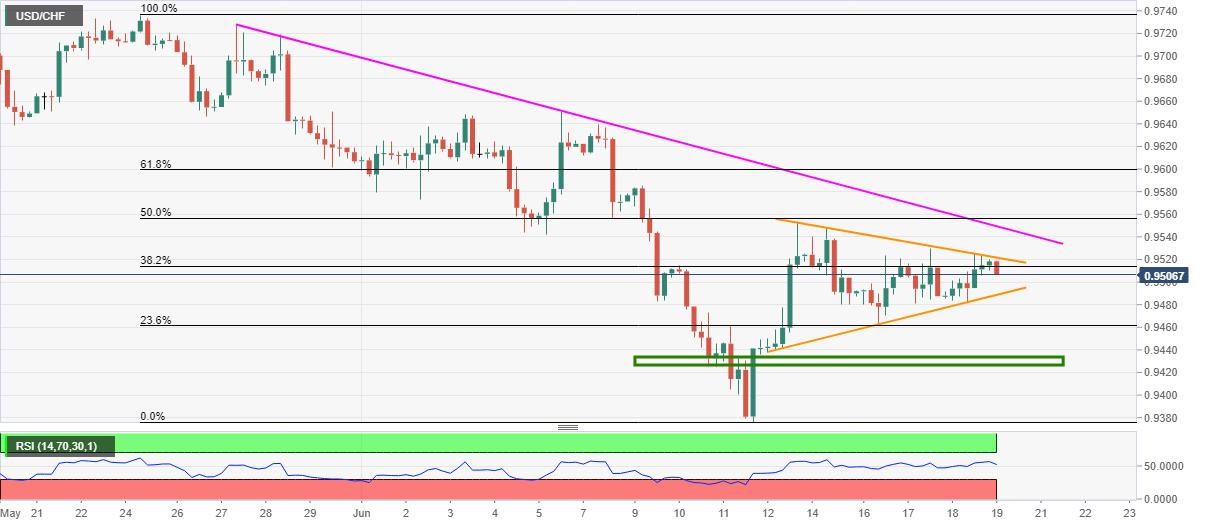
- USD/CHF recoveries from 0.9482 fail to defy one-week-old chart formation.
- Another falling trend line from May 27 adds to the upside barriers.
- 0.9430/35 can question sellers on the triangle’s downside break.
USD/CHF drops to 0.9510, down 0.05% on a day, during the early Friday. The pair’s latest fall could be traced from its pullback from a short-term symmetrical triangle on the four-hour chart.
Hence, the traders may expect further declines towards the pattern’s support line near 0.9485. However, the quote’s downside below the triangle’s support could quickly drag it to 0.9430/35 horizontal area.
If at all there prevails additional weakness past-0.9430, the monthly bottom near 0.9375 and 0.9320 may act as buffers during the slump to May month trough surrounding 0.9180.
Assuming the pair’s recoveries, an upside clearance of 0.9525 resistance will need validation from a three-week-old falling trend line, at 0.9550 to justify the strength in momentum.
As a result, the buyers could aim for 0.9600 and the monthly top close to 0.9650 during the additional rise past-0.9550.
USD/CHF four-hour chart
Trend: Sideways
Reprinted from FXStreet,the copyright all reserved by the original author.
Disclaimer: The content above represents only the views of the author or guest. It does not represent any views or positions of FOLLOWME and does not mean that FOLLOWME agrees with its statement or description, nor does it constitute any investment advice. For all actions taken by visitors based on information provided by the FOLLOWME community, the community does not assume any form of liability unless otherwise expressly promised in writing.
FOLLOWME Trading Community Website: https://www.followme.com


Hot
-THE END-