S&P 500 Price Analysis: US stocks en route to the 3000 mark and beyond

· Views 1,052
- S&P 500 bullish recovery from mid-March stays intact.
- The level to beat for bulls is the 3000 mark.
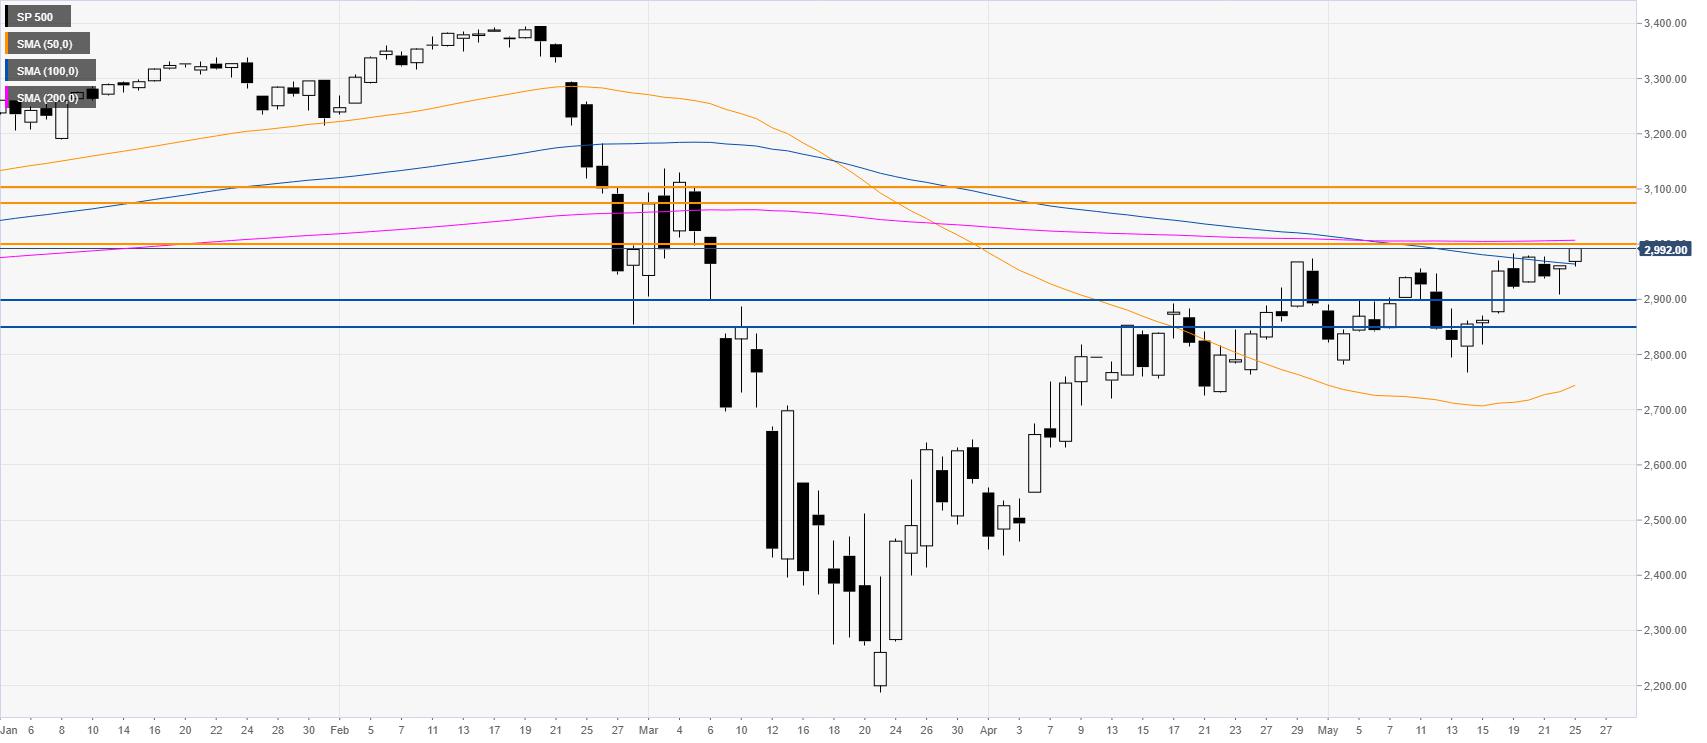
S&P 500 daily chart
After the February-March crash, the S&P 500 has been recovering a great part of its losses. The index is pressuring the May’s highs above the 100 SMA on the daily chart. As buyers stay firmly in charge, a run to the 3000 figure appears imminent. A sustained break above the mentioned level can see the S&P 500 hit the 3075/3100 price zone in the medium-term. On the flip side, support can be seen near the 2900 and 2850 levels.
Additional key levels
Reprinted from FXStreet,the copyright all reserved by the original author.
Disclaimer: The content above represents only the views of the author or guest. It does not represent any views or positions of FOLLOWME and does not mean that FOLLOWME agrees with its statement or description, nor does it constitute any investment advice. For all actions taken by visitors based on information provided by the FOLLOWME community, the community does not assume any form of liability unless otherwise expressly promised in writing.
FOLLOWME Trading Community Website: https://www.followme.com
If you like, reward to support.


Hot
No comment on record. Start new comment.