WTI Price Analysis: Hits lowest since January 2019, monthly chart shows major bear cross

With oil prices falling to 13-month lows, a widely-tracked lagging indicator has turned bearish for the first time in multiple decades.
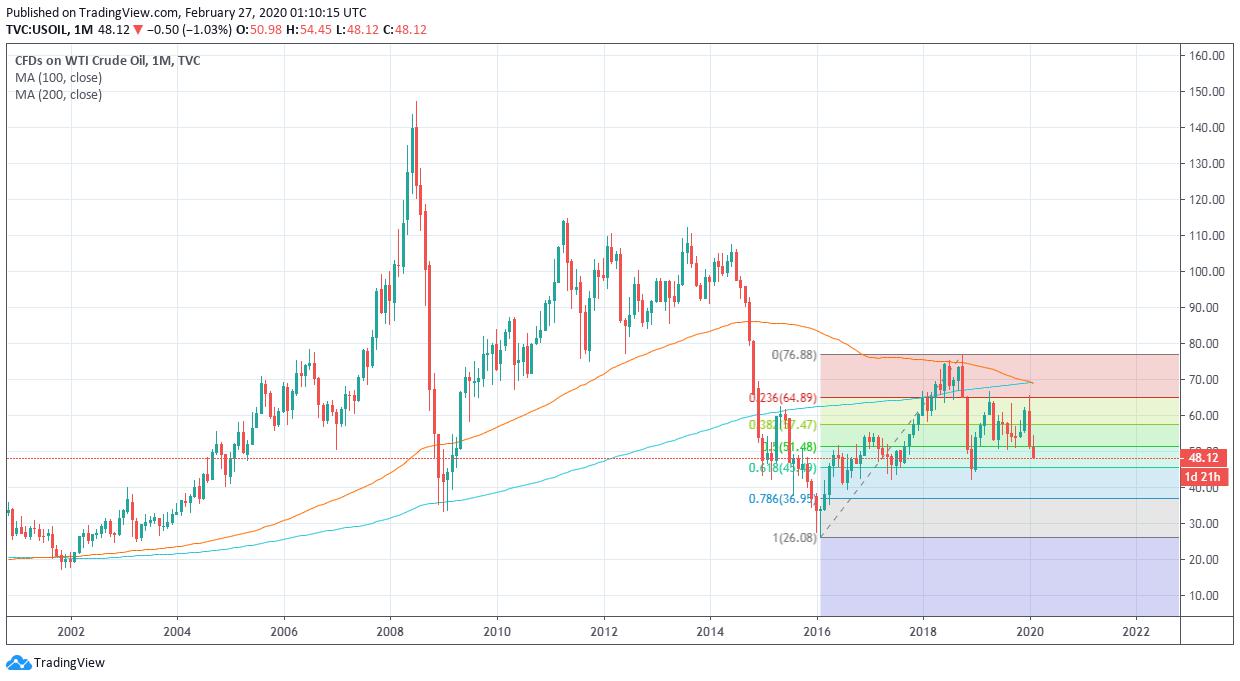
West Texas Intermediate (WTI) oil is currently trading at $48.34 per barrel, having hit a low of $48.21 a few minutes before press time. That level was last seen in the first half of January 2019.
The black gold is currently reporting a 9.4% slide on a week-to-date basis. The sell-off could be associated with the flight to safety triggered by concerns the coronavirus is
spreading outside China.
The US stocks fell for the third straight day on Wednesday with the Dow Jones Industrial Average falling by over 100 points. The index has lost over 2,000 points in the last three days.
Bear cross
The 100-month average (MA) has crossed below the 200-month MA, confirming a bearish crossover.
While technical analysis textbooks consider it as a warning of a bear market, in reality, it is a lagging indicator. After all, it is based on moving averages, which are backward-looking. More often than note, the market is oversold by the time the crossover happens and traps sellers with a notable corrective bounce.
The latest bear cross, however, is not accompanied by oversold readings on technical indicators. For instance, the 14-day relative strength is holding above 30 and well above the low of 19.40 observed on Feb. 4. Put simply, there is scope for further sell-off, especially if the risk aversion worsens. On the downside, support is located at $45.49 (61.8% Fibonacci retracement of the rally from $26.08 to $76.88).
Alternatively, if the coronavirus fears subside, a recovery rally to levels above $50 may be seen.
Monthly chart
Trend: Bearish
Technical level
Reprinted from FXStreet,the copyright all reserved by the original author.
Disclaimer: The content above represents only the views of the author or guest. It does not represent any views or positions of FOLLOWME and does not mean that FOLLOWME agrees with its statement or description, nor does it constitute any investment advice. For all actions taken by visitors based on information provided by the FOLLOWME community, the community does not assume any form of liability unless otherwise expressly promised in writing.
FOLLOWME Trading Community Website: https://www.followme.com


Hot
-THE END-