USD/IDR technical analysis: 14,140/45 is the level to beat for buyers

- Resistance-line of a short-term failing channel, 4H 200MA limit the USD/IDR pair’s latest recovery.
- 13,885 and channel’s support-line could please sellers during fresh entry.
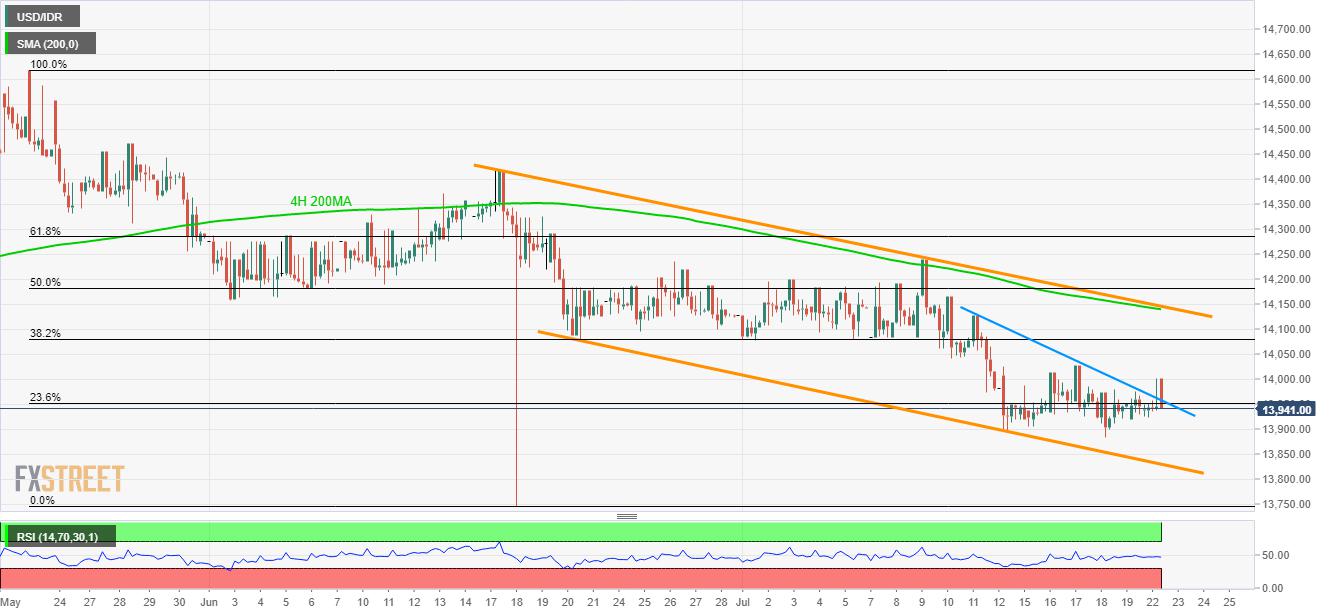
Having breached immediate resistance-line, USD/IDR takes the bids to 13,941 during early Tuesday.
Break of short-term upside barrier and absence of oversold technical indicators favors the pair’s further recovery towards last week's high around $14,030 and 38.2% Fibonacci retracement level of 14,080.
However, 200-bar moving average (4H 200MA) and upper-line of the channel can limit the quote’s further advances around 14,140/45.
In a case buyers refrain from respecting 14,145, 61.8% Fibonacci retracement level of 14,285 and June 18 high around 14,420 will become their targets.
On the contrary, 13,885 and channel-support close to 13,830 hold the keys to the quote’s fresh drop towards 13,750.
USD/IDR 4-hour chart
Trend: Pullback expected
Reprinted from FXStreet,the copyright all reserved by the original author.
Disclaimer: The content above represents only the views of the author or guest. It does not represent any views or positions of FOLLOWME and does not mean that FOLLOWME agrees with its statement or description, nor does it constitute any investment advice. For all actions taken by visitors based on information provided by the FOLLOWME community, the community does not assume any form of liability unless otherwise expressly promised in writing.
FOLLOWME Trading Community Website: https://www.followme.com


Hot
No comment on record. Start new comment.