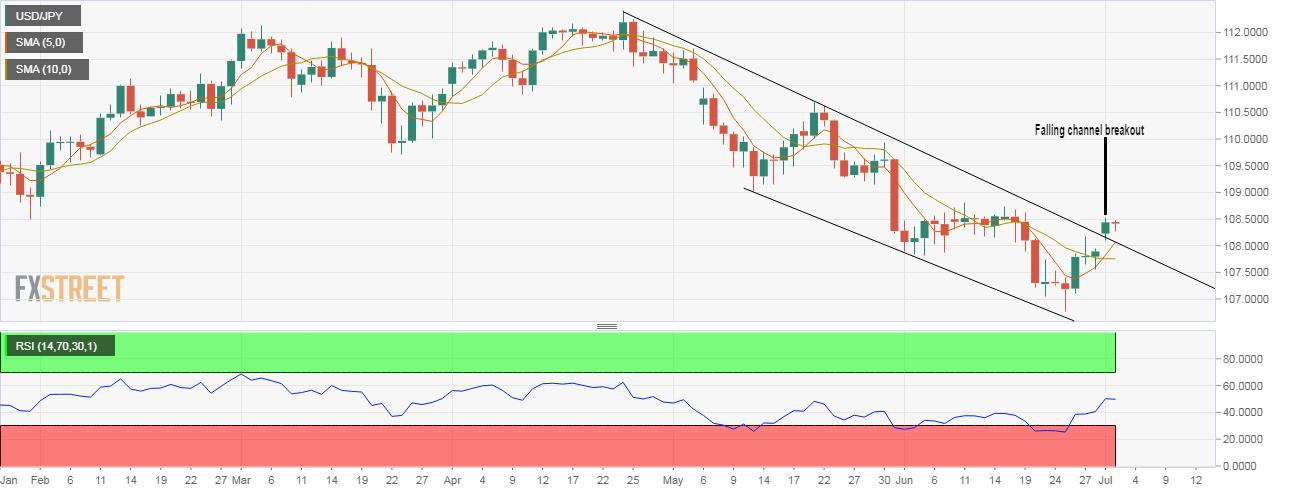
USD/JPY technical analysis: Off lows, looks north with falling channel breakout

- USD/JPY's daily chart shows a falling channel breakout.
- The short-term moving averages are biased bullish.
USD/JPY is currently trading largely unchanged on the day at 108.41, having hit a low of 108.27 earlier today.
The spot could continue to gain altitude during the day ahead as technical charts indicate the path of least resistance is to the higher side.
To start with, the pair closed 108.44 on Monday, confirming an upside break of a two-month-long falling channel.
Further, the 14-day relative strength index is now teasing a break above 50.00 (in bullish territory) and the 5- and 10-day moving averages (MAs) have produced a bullish crossover.
As a result, the immediate resistance at 108.80 (June 11 high) could soon come into play. A violation there would further validate the bullish breakout and open the doors to the 50-day MA, currently at 109.31.
A daily close below 108.10 (Monday's low) would weaken the bullish case.
Daily chart
Trend: Bullish
Pivot points
Reprinted from FXStreet,the copyright all reserved by the original author.
Disclaimer: The content above represents only the views of the author or guest. It does not represent any views or positions of FOLLOWME and does not mean that FOLLOWME agrees with its statement or description, nor does it constitute any investment advice. For all actions taken by visitors based on information provided by the FOLLOWME community, the community does not assume any form of liability unless otherwise expressly promised in writing.
FOLLOWME Trading Community Website: https://www.followme.com


Hot
No comment on record. Start new comment.