Tron (TRX) Price Analysis: Bears In Action Below $0.07

- Tron price started a fresh decline from the $0.0725 resistance against the US Dollar.
- TRX price is now trading below $0.0700 and near the 55 simple moving average (4-hours).
- There was a break below a key bullish trend line with support near $0.0700 on the 4-hours chart (data feed via Bitfinex).
- The pair could continue to move down if it stays below the $0.0700 pivot level.
TRON price started a fresh decline below $0.0725 against the US Dollar, similar to bitcoin. TRX price remains at a risk of more downsides towards $0.0620.
Tron Price Analysis
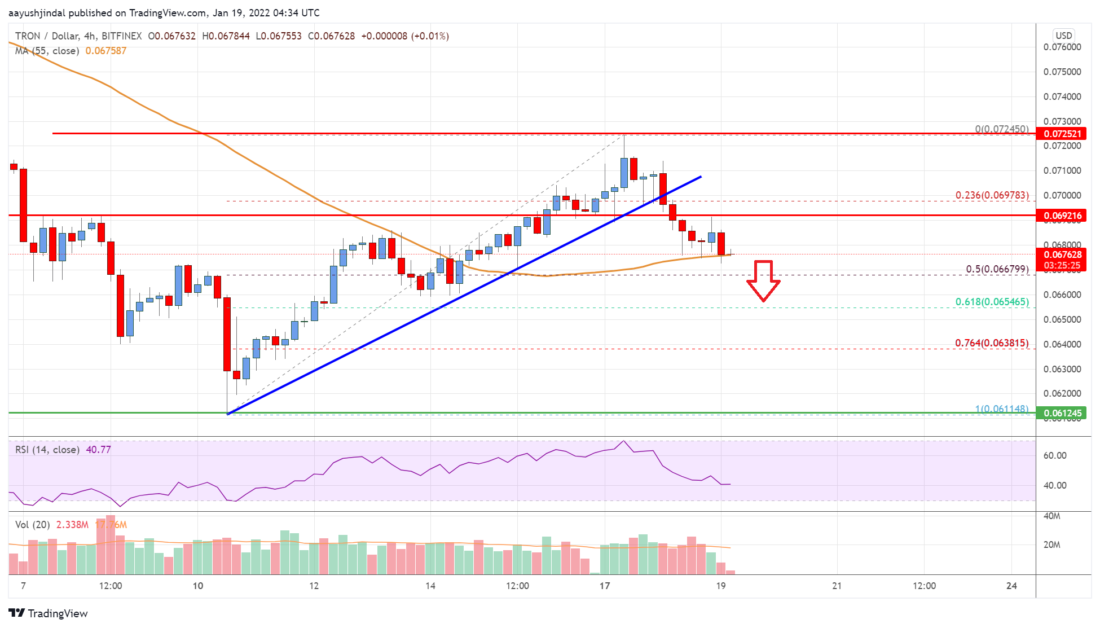
After facing resistance, tron price started a fresh decline below the $0.0725 level against the US Dollar. TRX price broke the $0.0700 support level to enter a bearish zone.
It even traded below the $0.0690 level and tested the 55 simple moving average (4-hours). The price moved below the 23.6% Fib retracement level of the upward move from the $0.0611 swing low to $0.0725 high. Besides, there was a break below a key bullish trend line with support near $0.0700 on the 4-hours chart.
It is now trading near the $0.0675 and the 55 simple moving average (4-hours). On the downside, an initial support is near the $0.0665 level.
The 50% Fib retracement level of the upward move from the $0.0611 swing low to $0.0725 high is also near the $0.0665 level. The next major support is now forming near $0.0650, below which there is a risk of a larger decline. The next key is near the $0.0600 level.
Any more losses might call for a move towards the $0.0550 level. An immediate resistance on the upside is near the $0.0690 level. The next major resistance is near the $0.0700 level.
A close above $0.0700 is must for a fresh increase. In the stated case, the price could rise towards the $0.0725 resistance in the near term. Any more gains could set the pace for a larger increase towards the $0.0800 level.
Tron (TRX) Price
The chart indicates that TRX price is now trading below $0.0700 and near the 55 simple moving average (4-hours). Overall, the price could continue to move down if it stays below the $0.0700 pivot level.
Technical Indicators
4 hours MACD – The MACD for TRX/USD is slowly gaining momentum in the bearish zone.
4 hours RSI – The RSI for TRX/USD is below the 50 level.
Key Support Levels – $0.0650 and $0.0620.
Key Resistance Levels – $0.0690, $0.0700 and $0.0725.
© cryptonews. Copyright and all rights therein are retained by authors.
Disclaimer: The content above represents only the views of the author or guest. It does not represent any views or positions of FOLLOWME and does not mean that FOLLOWME agrees with its statement or description, nor does it constitute any investment advice. For all actions taken by visitors based on information provided by the FOLLOWME community, the community does not assume any form of liability unless otherwise expressly promised in writing.
FOLLOWME Trading Community Website: https://www.followme.com


Hot
-THE END-