ADX: Find the Strong Trend

In a wide variety of indicators that provide different signals, it's almost impossible to find the one that defines the trend's strength. It's vital to know whether the trend is stable or not, especially during peak timeframes, when it exists from several days to several months. What if you see a trend and want to open a position but have no idea how soon it'll end? Wilder invented the ADX indicator specifically for cases like those.
What Is the ADX Indicator?
ADX stands for Average Directional Index. It's a technical indicator that is mainly used to determine the trend's strength. At the same time, it can be applied to find trends and ranges and filter trading strategies. Usually, the indicator consists of a single line that fluctuates within the 0-100 range.
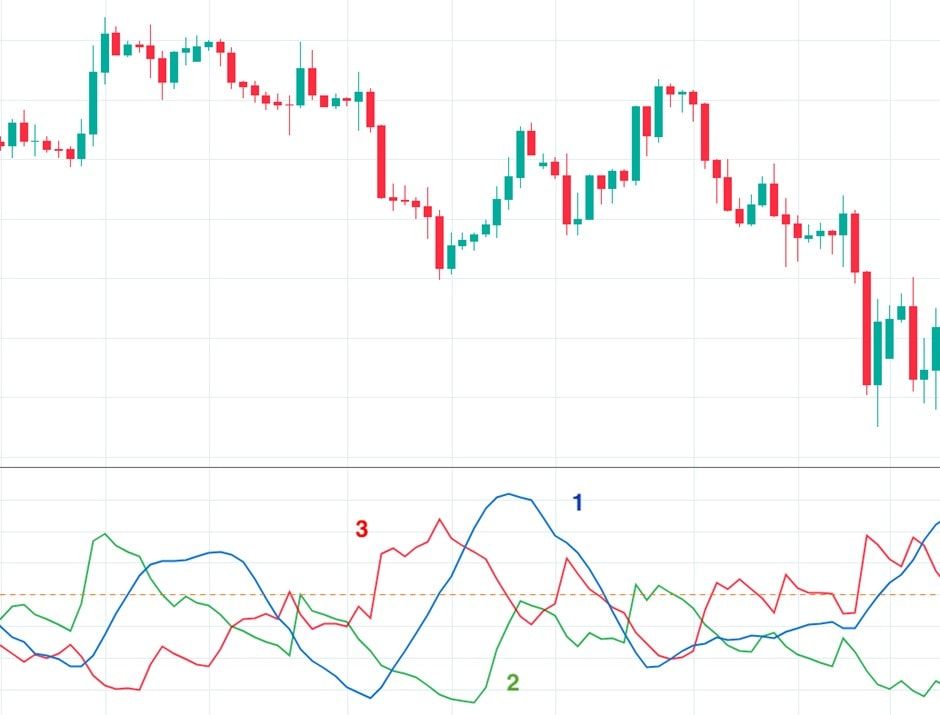
However, sometimes you can see the indicator of three lines: ADX, +ID and -ID. Two additional lines are a positive directional indicator and a negative directional indicator. These serve to provide the trend's direction, and the average directional index is derived from them.
The indicator was invented by the technical trader J. Welles Wilder, who described the average directional index together with the minus directional indicator (-DI) and the plus directional indicator (+DI) in his book New Concepts in Technical Trading Systems in 1978.
This index has been around for many years, proving that ADX can stand the test of time and provide valuable information. Have a look at the picture.
Why ADX Is So Popular
The ADX indicator is almost the only existing indicator that shows a trend's strength. Even though other indicators also provide signals that show close reversal or possible breakouts, the average directional movement index gives more accurate signals. Additionally, you can use this indicator to work in the forex market and to trade stocks, futures and even mutual funds.
ADX Calculation
The calculation may seem a little complicated, but you don't have to do it every time you use it because the calculation is done automatically. The ADX formula will just help you understand how the indicator works.
The calculation starts with measuring positive and negative directional movement.
- +DM = Current High - Previous High
- -DM = Previous Low - Current Low
There's an exciting feature here. If +DM is bigger than -DM, then -DM equals 0. If -DM is greater than +DM, +DM is 0. As we mentioned earlier, the index is derived from +DI and -DI. The positive directional indicator (+DI) amounts to 100 times the exponential moving average (EMA) of +DM divided by the ATR (average true range) over a given period of time.
The standard period is 14. The negative directional indicator (-DI) equals 100 times the EMA of -DM divided by ATR. As for the average directional index, it's equal to 100 times the EMA of the absolute value of (+DI minus -DI) divided by (+DI plus -DI).
Strong Signals From ADX
There's a common misconception that the indicator shows the trend direction. The indicator shows only the strength of that trend. If you want to get the direction, you need to use ADX together with the -DI and +DI. There's a drawback of ADX not always being accompanied by these two lines depending on the trading platform you use. We'll tell you both about the single ADX and ADX with two directional movement indicator lines to provide you with full information.
Basic Levels
If the indicator is below 25, the market is moving sideways. If the index is above 25, the market is forming a new trend, and the strength depends on the levels the indicator crosses.
ADX Value
Trend Strength
0-25
Absent or Weak Trend
25-50
Strong Trend
50-75
Very Strong Trend
75-100
Extremely Strong Trend
Trend Momentum
ADX reflects the trend's momentum. If the indicator forms a series of higher highs, the trend is gaining momentum (i.e., becoming stronger). If ADX forms a series of lower peaks, the trend momentum is shortening. However, if the peaks become smaller but the indicator remains above 25, that doesn't mean the trend is changing. It just means it's losing momentum.
Why do you need this information? When you know the trend's momentum is rising, you get more confidence in keeping your position. At the same time, when you see the indicator signals the weakness of the momentum, but the trend still interacts, it's a sign that you should manage risk.
This is where we can apply another strategy. If the indicator forms a divergence from the price chart, you should consider managing your risks. When the price creates a higher high, but the index doesn't follow it and instead forms a lower high, this is divergence. If you've heard something about RSI or MACD indicators, you know that divergence usually signals a market reversal. In this case, the signal isn't that strong. The index indicates that the trend is weakening. However, the weakness may end up in consolidation, a reversal or a continuation of the trend.
Breakouts
Breakouts happen in the market very often. It's common if the breakout fails to develop and becomes a trap for traders. It's essential to have an indicator that will either confirm or disprove them. The rule is simple: if the index rises in the range from 0 to 25, the price is strong enough to keep moving towards the breakout direction.
Ranges
It's vital to know when the trend transforms into the range. To find that out, follow the ADX. When the ADX falls from above 25 to below 25, it indicates a range. There's no trend until the index is in the bottom zone. As soon as it rises, the price starts moving according to the trend.
ADX and Two Directional-Movement Indicator Lines
As we stated above, the indicator is often followed by two lines that help define the trend's course. The signals are fairly simple.
- When +DI is higher than -DI, it's a bullish trend.
- If -DI is greater than +DI, the trend is bearish.
- Buy when +DI breaks above -DI. The ADX should be above 25.
- Sell when -DI rises above +DI. The ADX should be above 25.
How to Use ADX
The ADX is one of the fundamental indicators that's usually implemented into any trading platform. The only difference is that some platforms, for example, MetaTrader, provide the indicator with three lines while others have only one line.
To apply the indicator to the chart, you need to find it in the indicators list. In the settings, 14 is the standard number for the period. However, you can apply another one based on your trading strategy.
Common Mistakes with ADX
The indicator measures the trend's strength, not its direction, as many other indicators do. This is the most common mistake of a beginner trader. When you look at the index, you may associate it with the stochastic oscillator because it looks similar. The key levels are used to show how strong the trend is, not whether it's bearish or bullish.
Another mistake is reading the signal incorrectly. Newbies think that when the indicator drops, it means the trend is reversing. In fact, it only indicates that the trend is weakening. Until the indicator crosses 25, think of the trend as being weaker.
Every trader is eager to catch the signal to enter the market at the perfect level. However, not every sign is correct. Using the full system with ADX and directional indicator lines makes it easy to get confused. +DI and -DI are frequently intertwined, resulting in traders getting false signals. To avoid this, you need to compare signals provided by different indicators or candlesticks.
The Best ADX Trading Strategy
It's up to you to find the perfect settings for the indicator and include them in your trading strategy. However, we'd like to share the one method that can help you get some money.
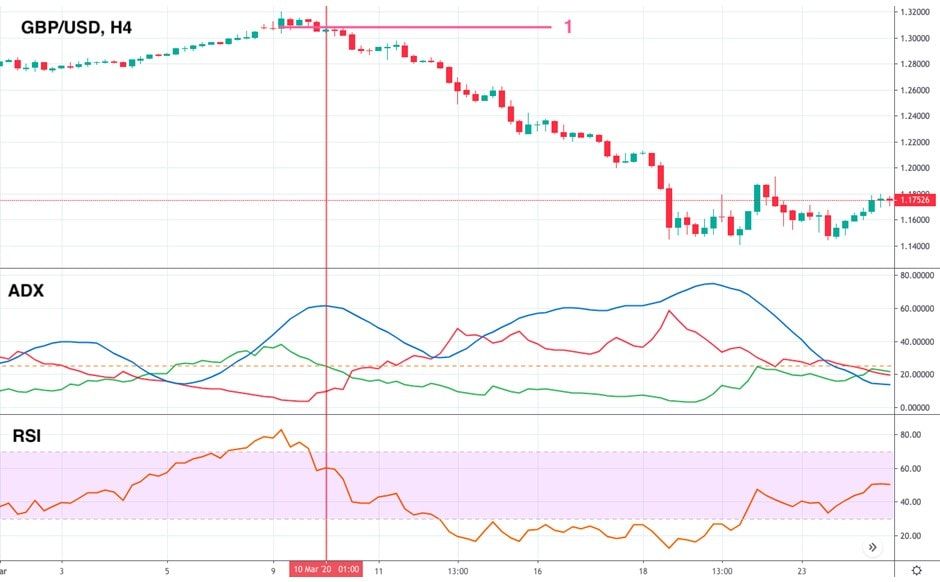
Step 1
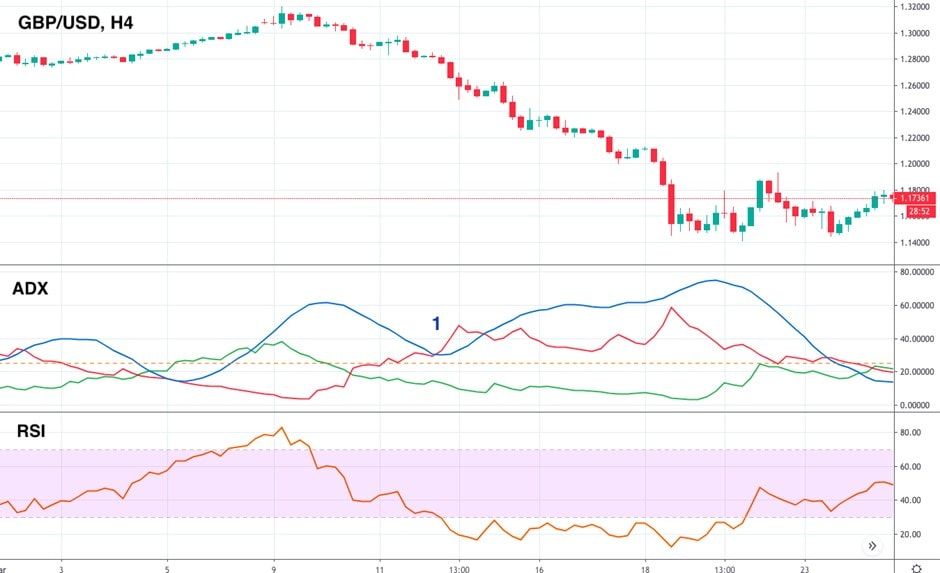
Choose an asset you'd like to trade and any timeframe that you're more familiar with. Apply the ADX and RSI indicators with standard settings to the chart. Before we determine whether the trend is bearish or bullish, we need the average directional index to be above 25. As you might already know, this signals a strong trend.
Step 2
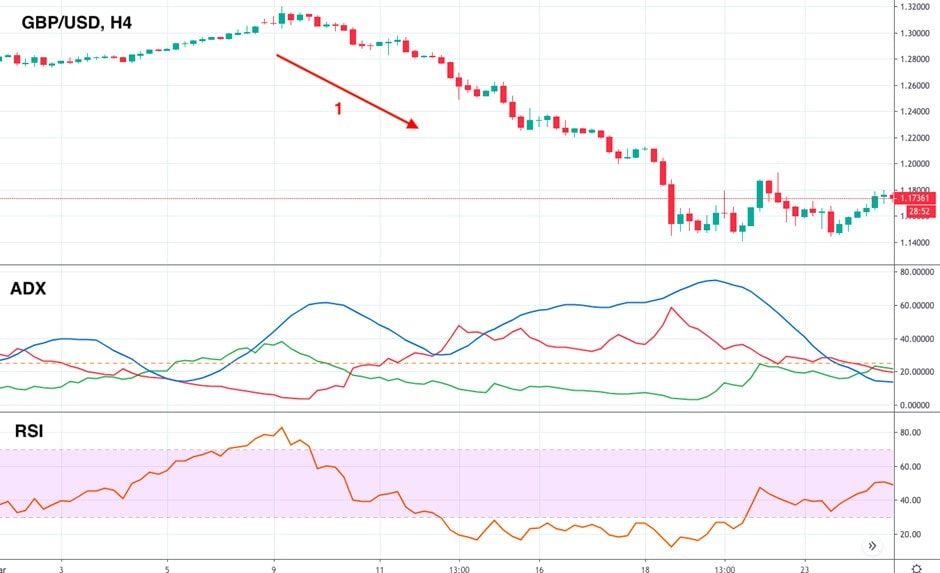
Looking at the last 10 candlesticks is enough to identify the trend. If the price is moving lower in the previous 10 candlesticks, it's a bearish trend. If it's moving up, it's a bullish trend. However, the number of candlesticks depends on the timeframe. The larger the timeframe is, the more candlesticks there should be.
Step 3
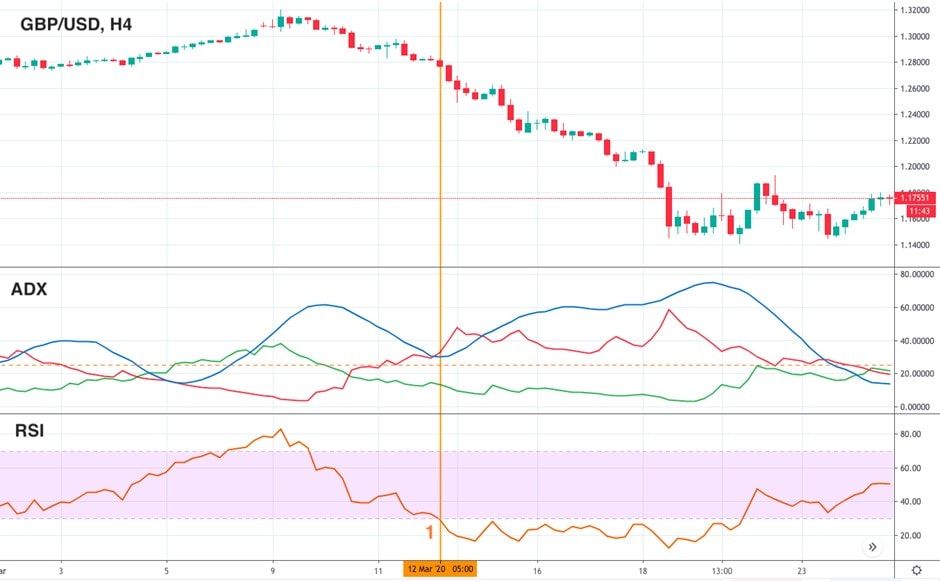
Follow the RSI indicator and trade within the downtrend. Wait for the RSI indicator to cross 30. As soon as the index drops below 30, open a sell position. If you've heard about the RSI indicator, you can be a little bit confused. According to the standard rules, readings below 30 signify an upcoming reversal as the market is oversold. However, it's essential to use the indicators correctly.
The RSI indicator can fluctuate in either oversold or overbought zone for an extended period in the strong trend. So, we need the ADX to signal a strong trend.
Step 4
It's time to define a stop-loss level that will neither throw you out of the market nor allow you to lose a lot. To find the perfect stop-loss level, you need to find where the ADX formed the last high before your entry. Correspond this high to the price chart, and you'll get the stop-loss level.
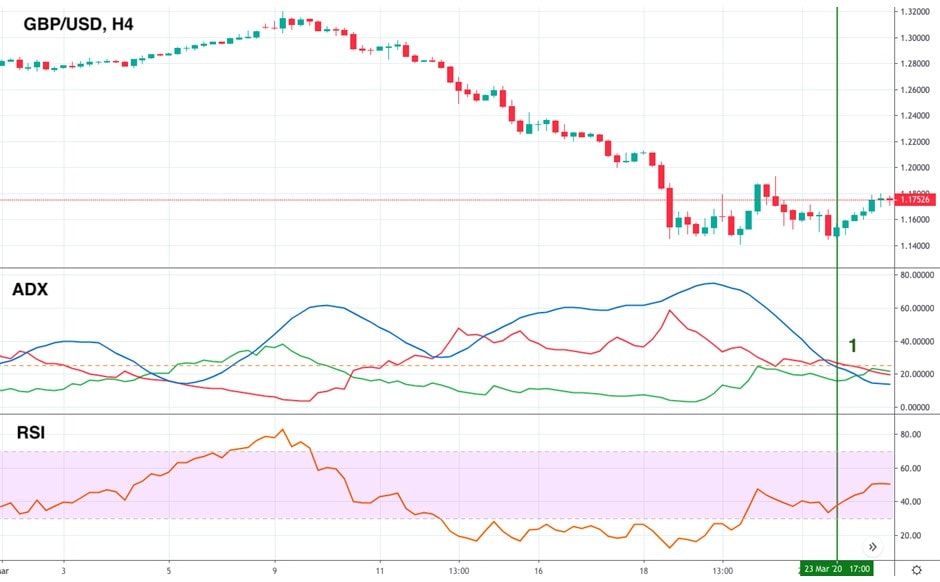
Step 5
In the beginning, we were looking for a strong trend. It's the most crucial part of our strategy. That's why we'll take the profit based on the trend strength. As soon as the trend fades, we should be ready to close the trade. Wait for the ADX to cross the 25 downward and close your position.
The strategy can easily be used in a bullish trend. All you need to do is use each step in the inverse.
FAQ
We've covered what the ADX is, but we'll review some of the most frequently asked questions once more.
Which Indicator Works Best With ADX?
The first indicator is the RSI. You shouldn't be surprised that one of the best trading strategies combines ADX and RSI signals. Although the RSI indicator is an oscillator and the ADX is a trend indicator, they work well together. Every trader knows that it's easier to trade with a trend, not with a sideways market. As such, the RSI may provide reliable entry points, while the ADX can give signals on the trend's power.
You can also use the index with other trend indicators, such as Parabolic SAR. It's worth choosing indicators that aren't based on Moving Averages. As a reminder, the ADX calculation includes the Exponential Moving Average.
Is the ADX a Leading or Lagging Indicator?
The average directional index is based on the exponential moving average. All moving averages lag in time. So, the ADX is a lagging indicator, but that's the only limitation it has. The ADX confirms a trend only after it's formed; it's impossible to predict the strength of something that doesn't yet exist.
Conclusion
The ADX indicator can be considered exceptional. It's almost the only indicator that provides a trader with information on trend strength. Remember: the trend is your friend. However, it's not as easy to find a strong trend. As a result, you might lose money during breakouts and fakeouts, trend reversals and market consolidation. To determine the indicator faster, check its signal with a risk-free Libertex demo account that lets you trade with simulated funds in an environment that mirrors real-world trading conditions.
Disclaimer: The content above represents only the views of the author or guest. It does not represent any views or positions of FOLLOWME and does not mean that FOLLOWME agrees with its statement or description, nor does it constitute any investment advice. For all actions taken by visitors based on information provided by the FOLLOWME community, the community does not assume any form of liability unless otherwise expressly promised in writing.
FOLLOWME Trading Community Website: https://www.followme.com


Hot
No comment on record. Start new comment.