Butterfly Patterns and How Catching One Help You Profit In The Forex Market

Now despite its pretty name, this pattern can help you catch some deadly market reversals. As ever there are a few different measurements and parameters that we need to learn for identifying this pattern so stick with me here as we go through those. We’ll take a look at a diagram of what the pattern should look like first of all before moving over to the charts and talking about precisely how to trade this pattern. Hopefully you’ll remember this from the beginner session, but don’t worry if not because this should refresh your memory.
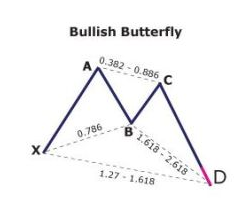
Ok so looking at a bullish butterfly pattern first of all. The basis of this pattern is that we have an initial bullish move in price which gives us our XA leg. We then get a correction lower which gives us our AB leg. This leg needs to retrace to 78.6% of the XA leg. This is then followed by a retracement higher giving us the BC leg which falls between 38.2% and 88.6% of the AB leg and then finally we get a push lower over the CD leg which actually takes price below the initial XA leg low and into the 127 – 161.8% extension of the XA leg where there should also be confluence with the 161.8 to 2.618% extension of the BC leg. The completion of the CD leg gives us our buying zone.
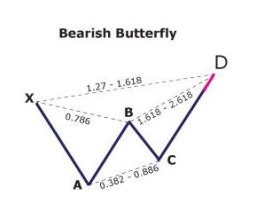
Ok, so looking at the bearish version of the pattern now which is just the exact inverse of the bullish structure. This time we start by identifying an initial bearish move in price which gives us our XA leg. We then get a correction higher which gives us our AB leg. This leg needs to retrace to 78.6% of the XA leg. This is then followed by a retracement lower giving us the BC leg which falls between 38.2% and 88.6% of the AB leg and then finally we get a push higher over the CD leg which actually takes price above the initial XA leg high and into the 127 – 161.8% extension of the XA leg where there should also be confluence with the 161.8 to 2.618% extension of the BC leg. The completion of the CD leg gives us our selling zone.
So, let’s move on and take a look at how these patterns look on the price charts.
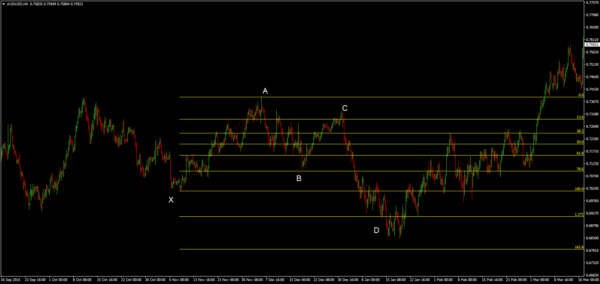
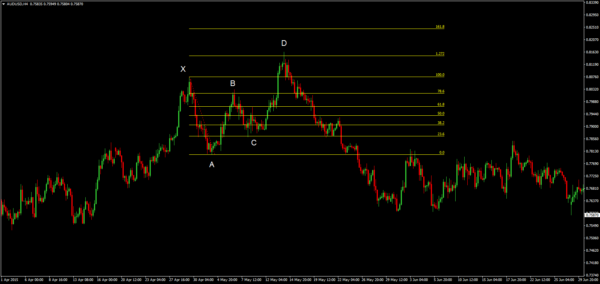
Ok so looking first of all at a bullish butterfly pattern then. So, you can see that we first of all identify our bullish move in price which gives us the XA leg. We then get a retracement all the way down to the 78.6% retracement of the XA leg giving us our AB leg. Price then reverses higher and trades back up to the 78.6% retracement of the AB leg giving us our BC leg. From here we then get a final push lower all the way down through the low of the XA leg low down to the 127% extension of the XA leg, giving us our CD leg and this also gives us our buying zone. So you can see that price chopped around at the 127% level for a little while before reversing higher and taking off.
So, because this is a bullish pattern we are looking to buy at the CD completion. So, when trading this pattern because we are looking for it to complete between the 127 and the 161 it is best to use price action to confirm which level we are going to trade at.
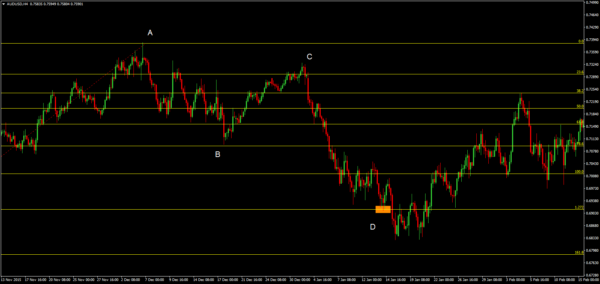
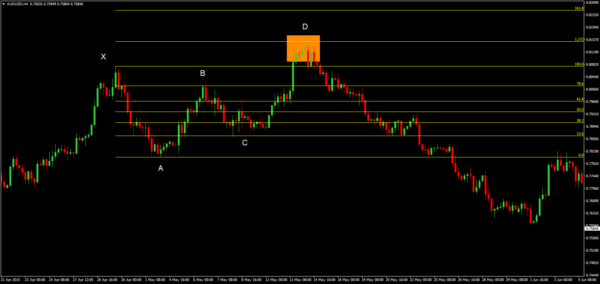
So, zooming in on this pattern you can see that as price tested the 127 level we got a reaction with the candles hitting the level and bouncing to close above it. So, we would enter our long trade at those candle closes and put our stop below the 161 extension which gives the trade some room to work. So, you can see that although we chopped around initially, actually falling back below the 127, eventually we broke to the topside and traded higher.
So, when we are trading this pattern, essentially, we are looking for price to trade back up to the high at XA which gives us a roughly 3.5 return on our risk. Now the key area that we need to monitor with this pattern is a retest of the XA low. Because this pattern is typically a counter trend pattern where price is trending lower and then we identify this pattern as a reversal, we need to be aware of the fact that the retest of the broken XA low could act as resistance and fuel a continuation of the trend lower. So, at this level we need to monitor price action and if we see any signs of a reversal we can move our stop to breakeven to protect against any reversal lower.
Once price has broken back above that low typically you will see the pattern play out back up to the target and any retest of the XA low from above should act as support.
So, let’s move on now and take a look at an example of a bearish butterfly pattern. You can see we have our initial bearish XA leg, then a retracement up to the 78.6% of that XA leg, before retracing lower to the 61.8% retracement of the AB leg, and then finally we get that last drive higher right up into the 127% extension of the XA leg where price holds and reverses lower.
So again, in terms of how we trade this pattern we can look to use price action to confirm which level we will trade. Now, just to reiterate, the reason why we do this is because the pattern is valid if it completes between the 127 and 161 however, if we simply enter at the 127 level we don’t know if price is going to simply carry on up and test the 161 so using price action can help us to work out which level to trade the pattern from.
In this instance you can see that we get a fantastic example of confluence between price action and the pattern because we actually get a bearish pin bar as price strikes the 127 level. The pin bar is a classic bearish reversal candle signalling an acute shift in sentiment over the session where buyers were in control initially, taking price higher, before sellers drove price lower to close the session near lows. So, the presence of this candlestick at the completion of the pattern gives us the green light to enter our short trade.
Disclaimer: The content above represents only the views of the author or guest. It does not represent any views or positions of FOLLOWME and does not mean that FOLLOWME agrees with its statement or description, nor does it constitute any investment advice. For all actions taken by visitors based on information provided by the FOLLOWME community, the community does not assume any form of liability unless otherwise expressly promised in writing.
FOLLOWME Trading Community Website: https://www.followme.com


Hot
-THE END-