缠绕理论基本概念

我长期观察和使用均线和rsi指标分析k线图,然后根据均线与k线的状态,将走势分为四种,k线的运行正是由这四种走势不断拼接而成。当我们明白了价格在各周期处于哪种走势,便会更加整体地看待价格变化,而不会因为某一根k线而慌神,一会儿看多一会多看空。
以下是基本概念:
…………………………………………………………………………
缠绕理论是以k线图加上10单位时间均线(以下简称均线)来分析走势的方法。
按k线与均线关系,分为四种走势:大缠绕,小缠绕,沿走,飞走。
1,大缠绕
第一根k线突破均线,第二根k线继续顺均线方向走,并且完全不触及均线,第三根均线没有继续趋势,又重新往均线靠拢,直到重新踩到均线。
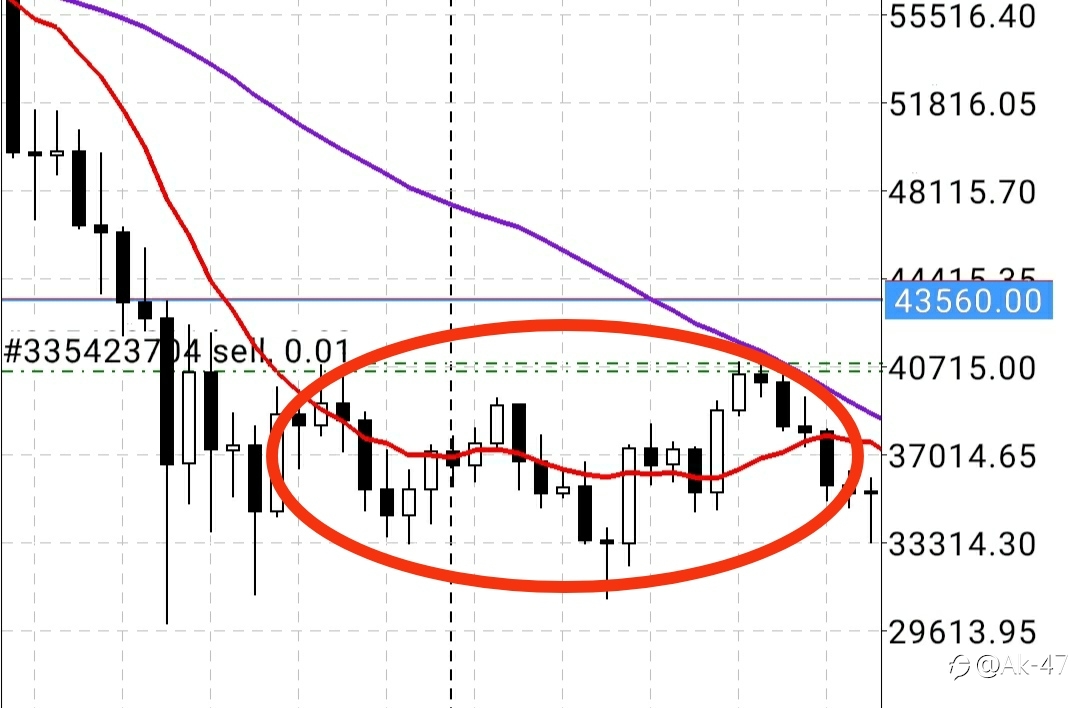
2,小缠绕
k线不形成连续攻击,一阴一阳k线实体部分贯穿均线(收盘价一根收在均线上,下一根收在均线下,连续交替出现)。
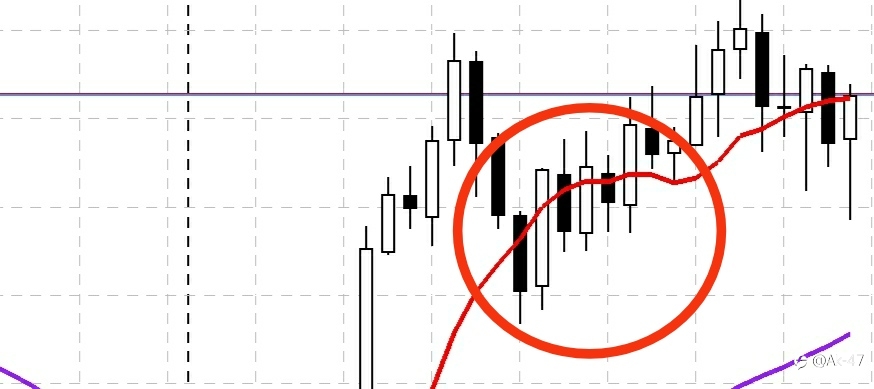

3,沿走
连续数根k线往同一个方向走,收盘价都在均线上面或者下面,每根k线又都碰触到均线。
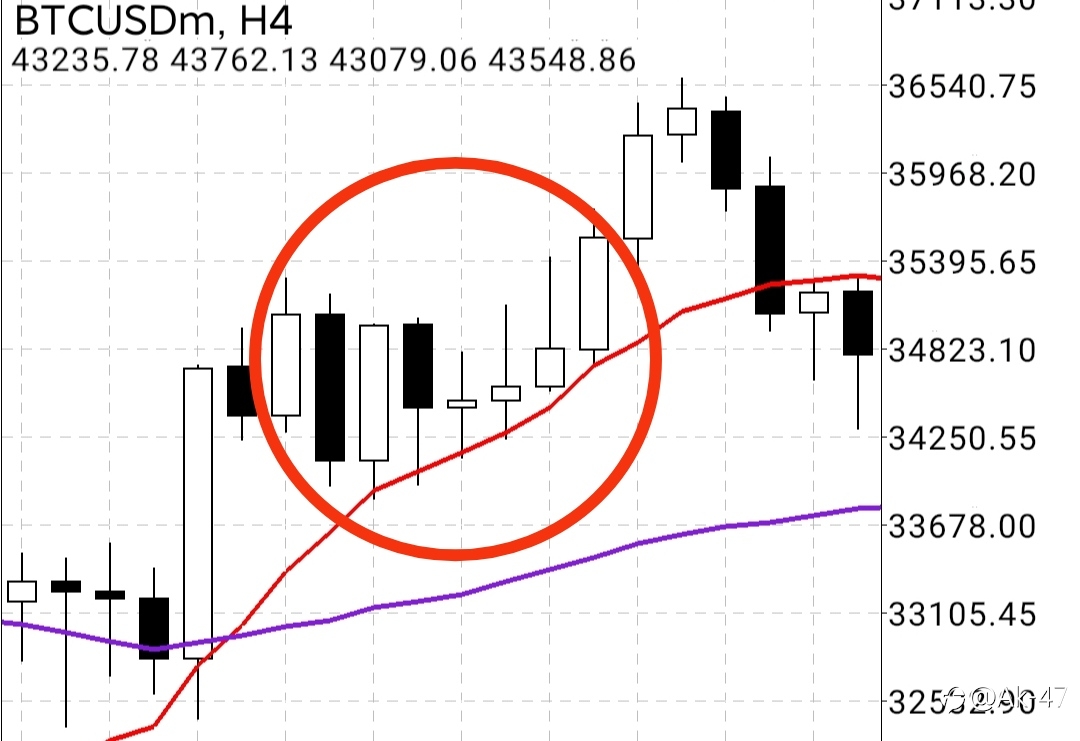

4,飞走
脱离均线后,出现连续两根以上k线不触碰均线,其间有阴线有阳线都无所谓,均视为强走势。
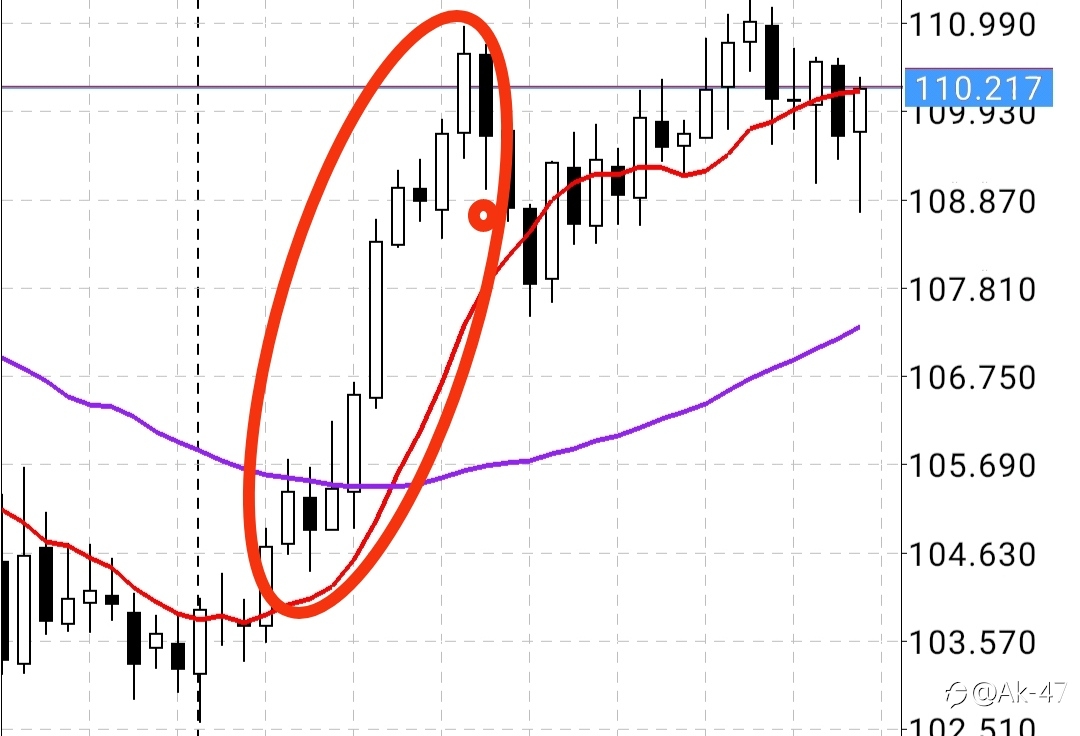

以上四种走势强弱关系为:
大缠绕≈小缠绕<沿走<飞走
接下来我会将理论应用在具体的图形分析和跟踪当中,沉淀到一定程度再作文字总结。
Disclaimer: The content above represents only the views of the author or guest. It does not represent any views or positions of FOLLOWME and does not mean that FOLLOWME agrees with its statement or description, nor does it constitute any investment advice. For all actions taken by visitors based on information provided by the FOLLOWME community, the community does not assume any form of liability unless otherwise expressly promised in writing.
FOLLOWME Trading Community Website: https://www.followme.com


Hot
No comment on record. Start new comment.